


AUD/NZD chart - Trading View
Technical Analysis: Bias Bearish
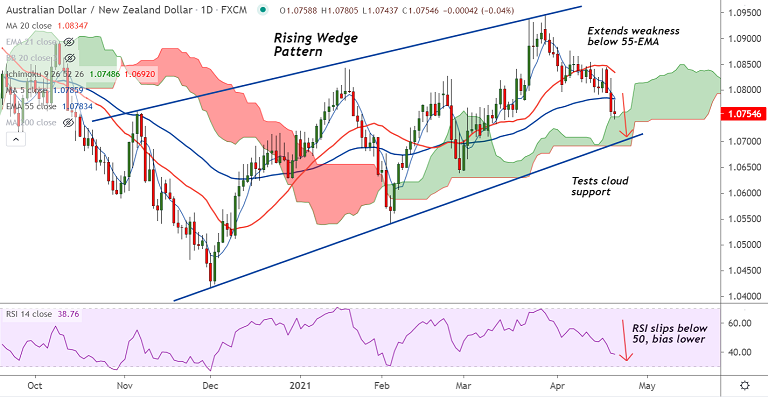
- Price action extends in Rising Wedge pattern
- Bearish 5-DMA and 20-DMA crossover
- Tests cloud support and trades pivotal at 200-DMA
- Stochs and RSI are biased lower, RSI well below 50 mark
- Volatility is rising as evidenced by widening Bollinger bands
Support levels - 1.0742 (nearly converged cloud and 200-DMA), 1.07 (Wedge base), 1.0671 (110W EMA)
Resistance levels - 1.0785 (nearly converged 5-DMA and 55-EMA), 1.0809 (21-EMA), 1.0813 (200H MA)
Summary: AUD/NZD finds major support at daily cloud and 200-DMA. Technical bias is bearish. Break below will drag prices lower. Scope for dip till Wedge base support at 1.07.


