


AUD/NZD chart - Trading View
Technical Analysis: Bias Bearish
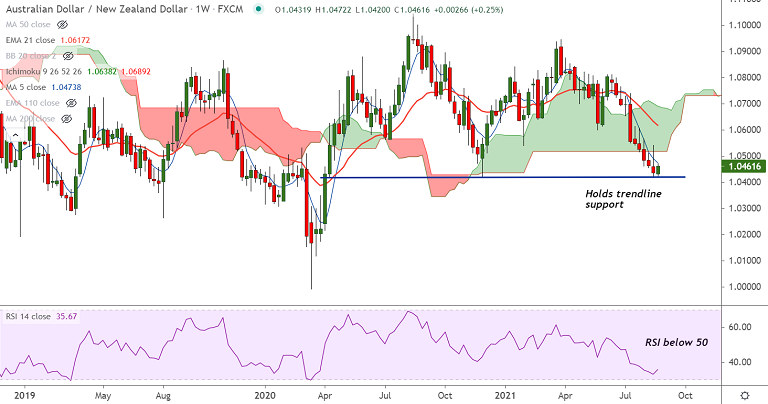
- AUD/NZD has opened the week on a bullish note
- Price action has paused 6 week's bearish streak
- Strong trendline support is seen at 1.0420, further weakness only on break below
- GMMA indicator shows major and minor trend are strongly bearish
- Price action is below daily cloud and major moving averages
Support levels - 1.0420 (trendline), 1.04 (Lower W BB), 1.0307 (Jan 2020 low)
Resistance levels - 1.0466 (5-DMA), 1.0473 (200H MA), 1.05 (21-EMA)
Summary: AUD/NZD trades with a major bearish bias. The pair has held major support at trendline at 1.0420.
Recovery attempts lack traction. Decisive break above 21-EMA to change near-term dynamics. Break below 1.0420 will plummet prices.


