


AUD/NZD chart - Trading View
Technical Analysis: Bias Bearish
- AUD/NZD was extending the bearish gap open and was trading 0.04% lower on the day at 1.0730 at around 08.15 GMT
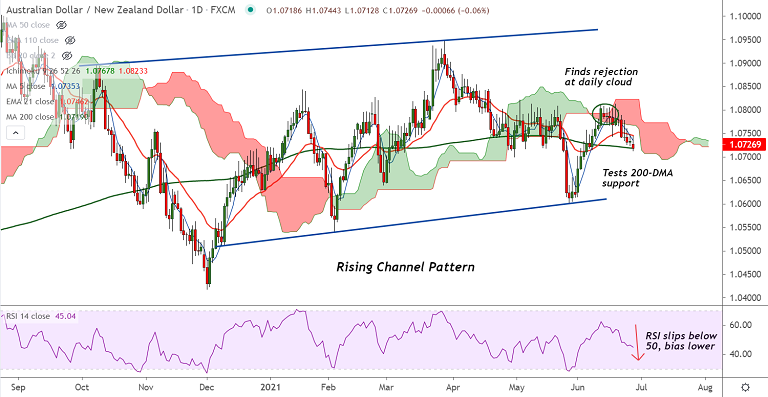
- The pair saw a brief dip below 200-DMA support, close below will open downside
- Recovery attempts were capped at 21-EMA, a spinning top on Friday's candle shows some hesitation to drive prices lower
- 5-DMA is biased lower, and is showing a bearish crossover on 20-DMA, adding to the downside bias
- Stochs and RSI are biased lower, momentum is bearish, volatility is shrinking as evidenced by narrowing Bollinger bands
- MACD shows bearish crossover on signal line, ADX support weakness
Support levels - 1.0719 (200-DMA), 1.07 (Psychological mark), 1.0682 (50% Fib)
Resistance levels - 1.0736 (5-DMA), 1.0746 (21-EMA), 1.0762 (200H MA)
Summary: AUD/NZD pivotal at 200-DMA support at 1.0719, breach below will open further downside. Next major bear target lies at 50% Fib at 1.0682.


