


 Oil Prices Dip Slightly Amid Focus on Russian Sanctions and U.S. Inflation Data
  Energy Sector Outlook 2025: AI's Role and Market Dynamics
  China’s Growth Faces Structural Challenges Amid Doubts Over Data
  Mexico's Undervalued Equity Market Offers Long-Term Investment Potential
  Lithium Market Poised for Recovery Amid Supply Cuts and Rising Demand
  Moody's Upgrades Argentina's Credit Rating Amid Economic Reforms
  Stock Futures Dip as Investors Await Key Payrolls Data
  Indonesia Surprises Markets with Interest Rate Cut Amid Currency Pressure
  Geopolitical Shocks That Could Reshape Financial Markets in 2025
  Wall Street Analysts Weigh in on Latest NFP Data


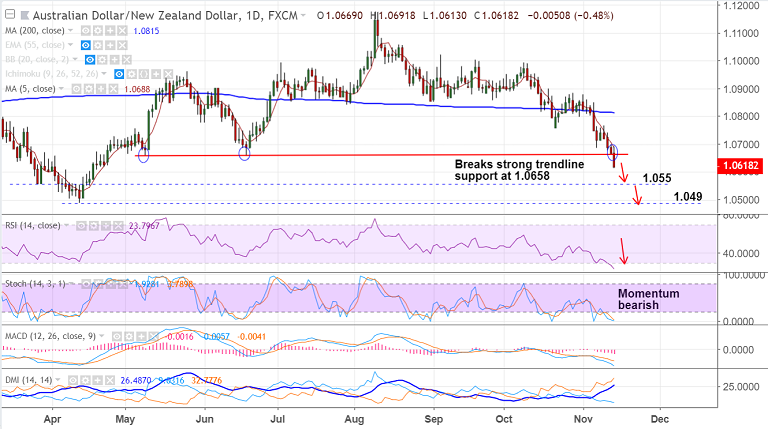
AUD/NZD chart on Trading View used for analysis
- AUD/NZD slumps lower on the day, is trading at 1.0617, down 0.48% at the time of writing.
- The pair has broken major trendline support at 1.0658 and we see scope for further weakness.
- Momentum studies are highly bearish on the daily and weekly charts. We see some oversold pressures on the dailies which could see some pullbacks.
- For now we do not see any major signs of reversal. Volatility is on the rise on weekly charts, momentum with the bears.
- We see strong support at 1.0585 (Triangle base). Breach there will accentuate weakness. Next bear targets below 1.0585 are 1.0550 and then 1.0490.
- Breakout above 200-DMA will invalidate our bearish bias.
Support levels - 1.0585 (Triangle base), 1.0550 (trendline), 1.0488 (Apr 12 low)
Resistance levels - 1.0658 (trendline), 1.0685 (5-DMA), 1.0774 (21-EMA)
Recommendation: Stay short on break below 1.0585, target 1.055/ 1.0485
For details on FxWirePro's Currency Strength Index, visit http://www.fxwirepro.com/currencyindex.


