


 China’s Growth Faces Structural Challenges Amid Doubts Over Data
  Stock Futures Dip as Investors Await Key Payrolls Data
  FxWirePro: GBP/USD slips as dollar extends gains after US PMI data
  Major Currency Score: EUR/USD, GBP/USD, AUD/USD & NZD/USD Extremely Bearish (-100); USD/CHF & USD/CAD Extremely Bullish (+100)
  FxWirePro: NZD/USD hovers near 0.5600,outlook strongly bearish
  U.S. Stocks vs. Bonds: Are Diverging Valuations Signaling a Shift?
  2025 Market Outlook: Key January Events to Watch
  FxWirePro- Major Pair levels and bias summary
  Energy Sector Outlook 2025: AI's Role and Market Dynamics
  Moody's Upgrades Argentina's Credit Rating Amid Economic Reforms
  JPY Major Currency Score – Pairs Trades Flat & Good to Avoid
  FxWirePro: USD/JPY firms as bearish yen sentiment persists
  U.S. Treasury Yields Expected to Decline Amid Cooling Economic Pressures
  Fed May Resume Rate Hikes: BofA Analysts Outline Key Scenarios
  FxWirePro- Woodies Pivot (Major)
  Goldman Predicts 50% Odds of 10% U.S. Tariff on Copper by Q1 Close
  FxWirePro- Major Pair levels and bias summary


 Add as a preferred source on Google
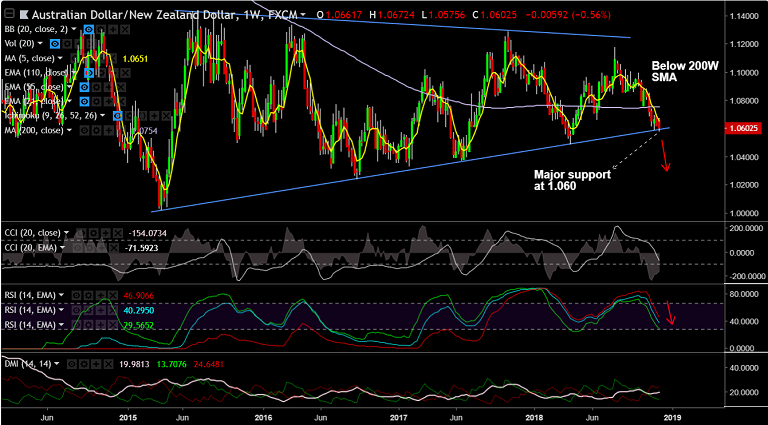
AUD/NZD chart on Trading View used for analysis
- AUD/NZD has been trading in a "Symmetric Triangle" pattern, bias remains bearish.
- The pair is testing 'Triangle Base' support at 1.06 and break below will see weakness.
- We see little support till 1.0488 (Apr 2018 low). Further weakness can drag the pair till 1.0370 (Jun 2017 low).
- Technical indicators on weekly charts are bearish. Stochs and RSI sharply lower.
- MACD supports downside. We see -ve DMI dominance and ADX rising in support of weakness.
- Price has slipped below weekly cloud and 200 SMA and we see bearish invalidation only on retrace above 200W SMA.
Support levels - 1.06 (Triangle base), 1.0488 (Apr 2018 low), 1.0370 (Jun 2017 low)
Resistance levels - 1.0630 (5-DMA), 1.0754 (200-W SMA)
Recommendation: Watch out for breach at Triangle base for weakness, target 1.0490
For details on FxWirePro's Currency Strength Index, visit http://www.fxwirepro.com/currencyindex.







