


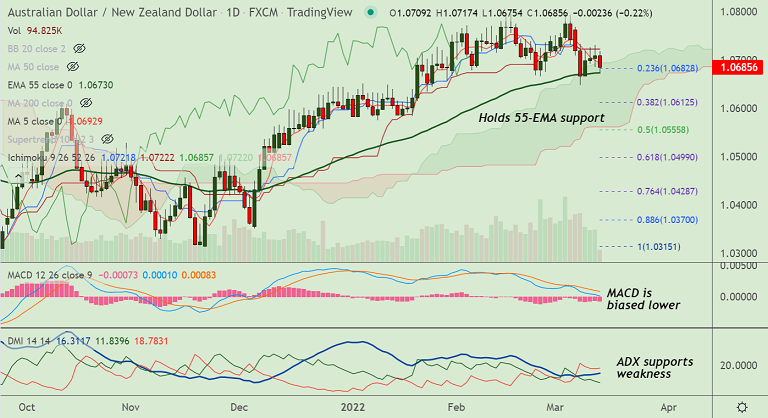
Chart - Courtesy Trading View
Technical Analysis: Bias Bearish
- AUD/NZD was trading 0.26% lower on the day at 1.0681 at around 08:10 GMT
- The pair is extending weakness for the 2nd straight week after Doji formation shy of channel top
- Price action has dipped into the daily cloud, Chikou span is biased lower
- MACD and ADX support downside in the pair. Recovery is capped at 200H MA
- GMMA indicator has turned bearish on the near-term, stochs and RSI show bearish momentum
Support levels - 1.0682 (23.6% Fib), 1.0672 (55-EMA), 1.0629 (200-week MA)
Resistance levels - 1.0692 (5-DMA), 1.0711 (21-EMA), 1.0719 (20-DMA)
Summary: AUD/NZD pivotal at 55-EMA support. Watch out for break below for further weakness.


