


Chart - Courtesy Trading View
Technical Analysis:
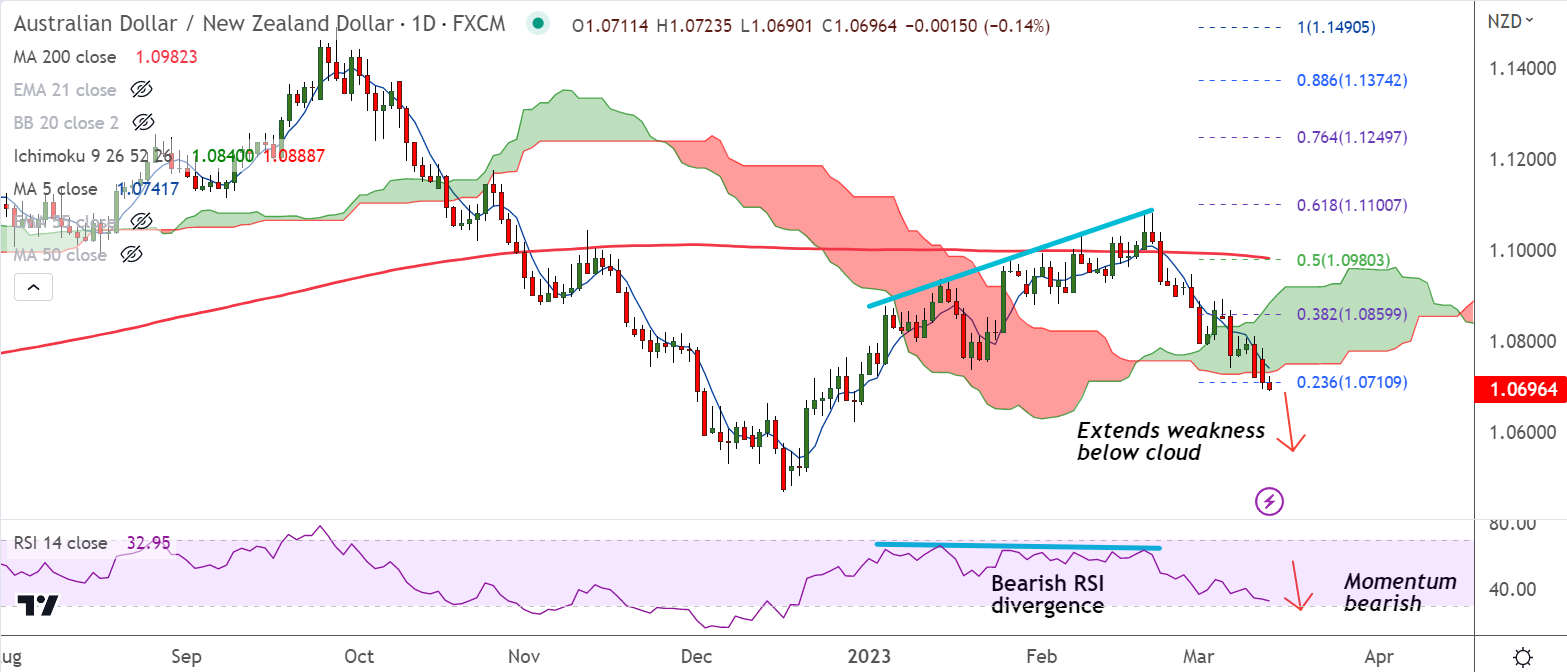
- AUD/NZD was trading 0.15% lower on the day at 1.0695 at around 10:35 GMT
- The pair is extending break below daily cloud, more weakness on cards
- GMMA indicator shows major and minor trend are bearish, price action below major moving averages
- Momentum is bearish, Stochs and RSI are sharply lower, volatility is high and rising
- MACD and ADX support downside in the pair, Chikou span is biased lower
Support levels:
S1: 1.0661 (Lower BB)
S2: 1.0622 (29th Dec 2022 low)
Resistance levels:
R1: 1.0741 (5-DMA)
R2: 1.0796 (200H MA)
Summary: AUD/NZD trades with a bearish bias. Price action hovers around 200-week SMA which is strong support at 1.07. Decisive break below 200-week SMA will confirm further downside.


