


Chart - Courtesy Trading View
Technical Analysis:
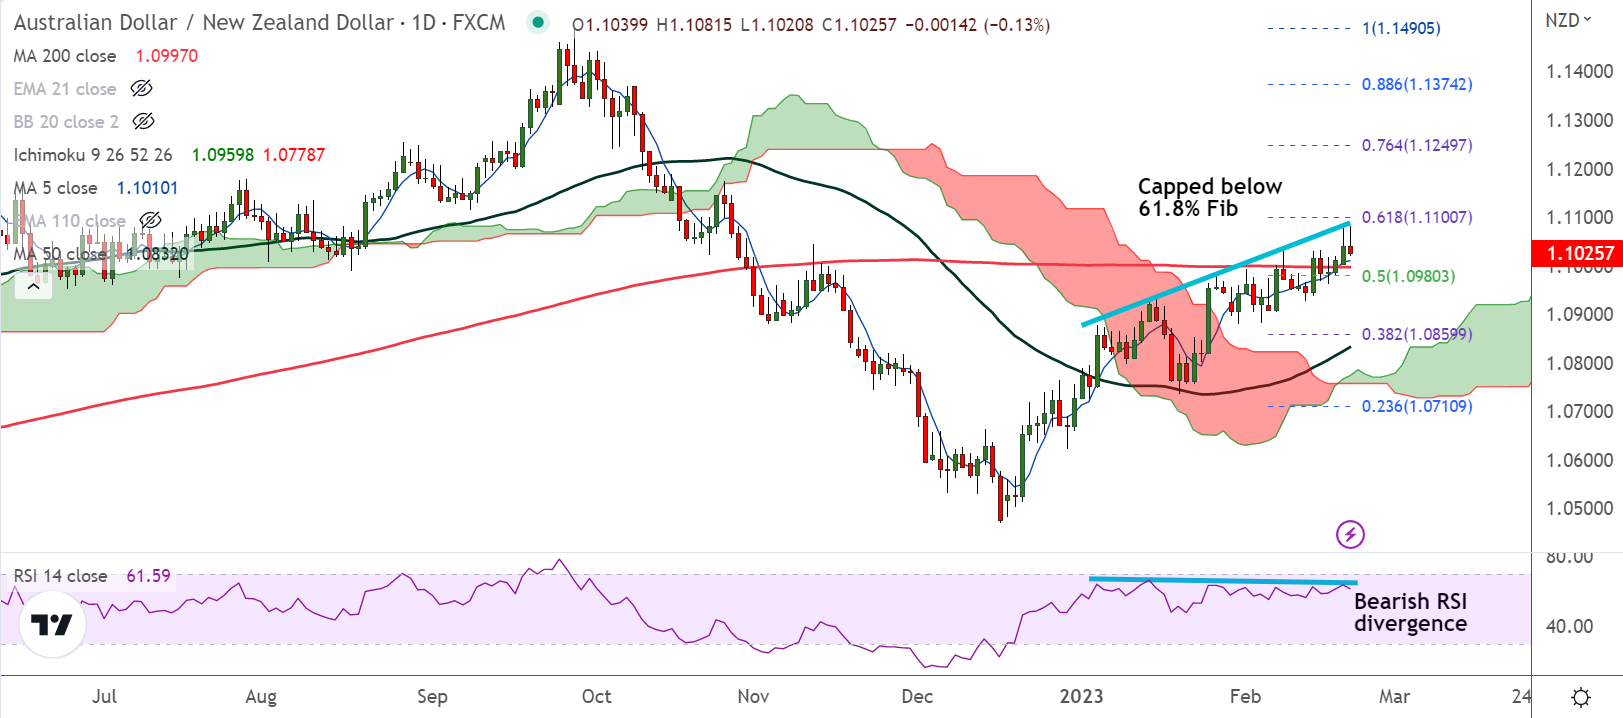
- AUD/NZD was trading 0.13% lower on the day at 1.1025 at around 11:45 GMT
- The pair has slipped lower from session highs at 1.1081, remains capped below 61.8% Fib
- GMMA indicator shows major and minor trend are bullish on the daily charts
- Momentum is bullish, stochs and RSI are sharply higher, Chikou span is biased higher
- The pair is extending gains for the fifth straight week, but bearish RSI divergence keeps scope for weakness
Support levels - 1.1009 (5-DMA), 1.0997 (200-DMA)
Resistance levels - 1.1100 (61.8% Fib), 1.1175 (Oct 26th high)
Summary: AUD/NZD trades with a bullish bias. However, bearish RSI divergence and long upper wicks on the daily candles keeps scope for weakness.
200-DMA is major support. Retrace below 200-DMA will negate any further bullishness.


