


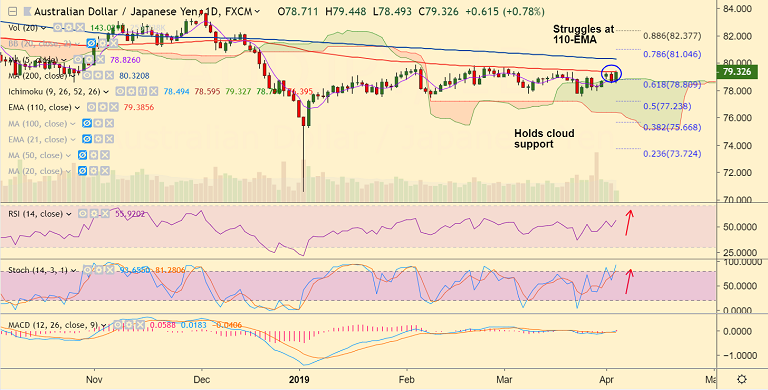
AUD/JPY chart - Trading View
- AUD/JPY is consolidating break above daily cloud, bias is bullish.
- The pair is currently trading at 79.33 at 1100 GMT, up 0.79% on the day.
- Antipodeans buoyed on positive macro-economic data and signs of progress in Sino-U.S. trade talks.
- China services PMI rose to 54.4 index points in March, beating an expected rise to 52.3 index points from February's reading of 51.1 index points.
- Also, Australia retail sales jumped 0.8 percent in February and the trade surplus widened to AUD 4,801 million.
- Technical indicators on daily charts are bullish. The pair has broken out of daily cloud and is struggling at 110-EMA resistance.
- Break above 110-EMA will see further upside. Scope for test of 200-DMA at 80.32.
- Strong support is seen at 78.85 to 78.75 zone, break below will see dip till 50% Fib at 77.23.
Support levels - 78.80 (cloud top), 78.75 (21-EMA), 77.91 (Mar 28 lows), 77.23 (50% Fib)
Resistance levels - 79.383 (110-EMA), 80.32 (200-DMA), 81.04 (78.6% Fib)
Recommendation: Good to go long on break above 110-EMA, SL: 78.75, TP: 80/ 80.35/ 81
For details on FxWirePro's Currency Strength Index, visit http://www.fxwirepro.com/currencyindex.


