


 BTC Flat at $89,300 Despite $1.02B ETF Exodus — Buy the Dip Toward $107K?
  JPMorgan Lifts Gold Price Forecast to $6,300 by End-2026 on Strong Central Bank and Investor Demand
  Nasdaq Proposes Fast-Track Rule to Accelerate Index Inclusion for Major New Listings
  Elon Musk’s Empire: SpaceX, Tesla, and xAI Merger Talks Spark Investor Debate
  FxWirePro- Major Crypto levels and bias summary


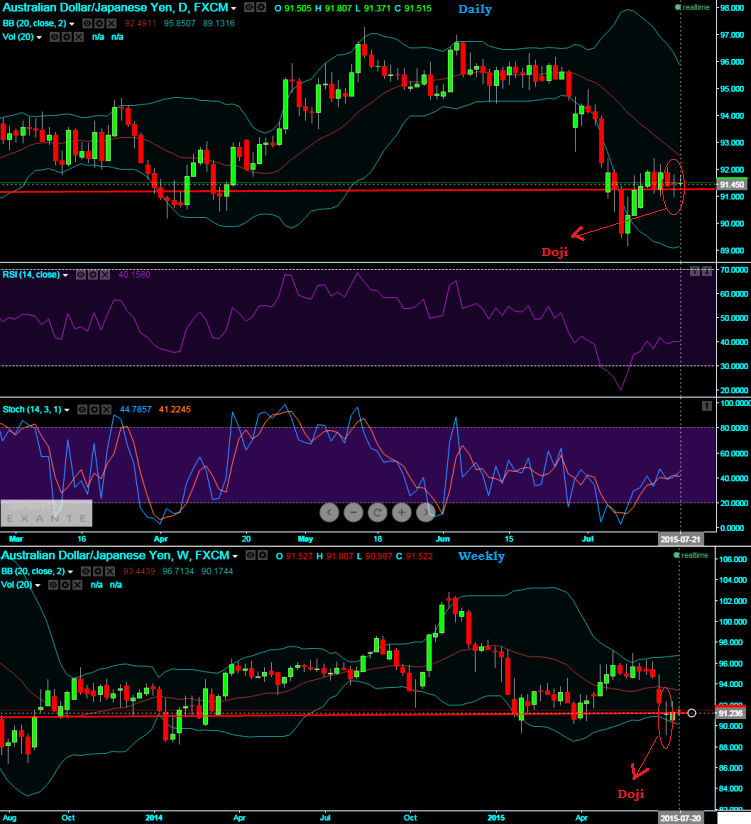
This APAC pair held firmly the strong support (91.229) which we traced yesterday, however EOD, weekly and monthly graphs suggest bearish signals, the pair is currently testing a crucial support at around 91.229 levels on both weekly and EOD charts.
More importantly a Doji pattern candle occurred at 91.243 levels on weekly and again at 91.505 on EOD charts. The occurrence of Doji at this stage to signifies weakness in this pair.
Leading oscillators like RSI and slow stochastic curves began showing divergence with the previous upswings; we believe any breach of this level on either side would determine the direction of next trend but little bias towards south.
Put Ratio Back Spread: AUD/JPY
With the above technical reasoning, we recommend arresting further downside risks of this pair by hedging through Put Ratio Back Spread.
The recommednation would be purchasing 1M 2 lots of At-The-Money -0.52 delta puts and sell 1M one lot of (1%) In-The-Money put option. (Usually in the ratio of 2:1 or 3:2) expecting the underlying currency exchange rate of AUDJPY to make a larger move on the downside.
The short ITM puts funds to the purchase of the greater number of long puts and the position is entered for no cost or a net credit. The delta of combined positions should be around -0.38 with slightly negative theta value.
If a disciplined hedger strictly follows all these mathematical computations, then irrespective of market sentiments, one can be rest assured with the risk-free exposures in his foreign trade.
The underlying exchange rate has to make substantial move on the downside for the gains in long puts to overcome the losses in the short puts as the maximum loss is at the long strike. Give it abundant time for expiration so as to make a substantial move on the downside.

- News

- Economy

- Central Banks
- Investing
- Research
- Roundups
- Digital Currency
- Insights
- Technical Analysis
- Technology
- Business
- Law
- Health
- Nature
- Fintech
- Science
- Topic
- Opinions
- ©Econometrics LLC . All Rights Reserved.
FxWirePro: AUD/JPY holds crucial support at 91.229 but DOJI signals bearish trend; PRBS for hedging
Tuesday, July 21, 2015 5:46 AM UTC
Editor's Picks


- Market Data
Most Popular


