


AUD/JPY chart - Trading View
AUD/JPY was trading 0.15% higher on the day at 76.59 at around 09:00 GMT, outlook remains bullish.
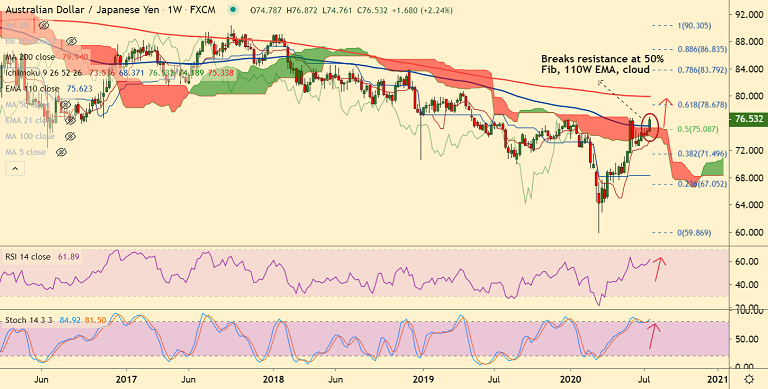
The pair has hit highest since May 2019 at 76.87 in the previous session and technical indicators support further upside.
Price action is extending in a 'Rising Triangle' pattern and breakout at 'Triangle Top' resistance at 76.85 will propel the pair higher.
Volatility is rising on the daily and weekly charts as evidenced by widening Bollinger bands.
Price action has broken above major resistance at 50% Fib retracement (90.305 to 59.869), weekly cloud and 110W EMA.
Momentum studies are bullish. Major and minor trend according to the GMMA indicator support upside.
Bulls target 200W MA at 79.94. Pullbacks likely to be shallow. 21-EMA is strong support at 74.91. Major weakness only below 200-DMA.
Major Support: 74.91 (21-EMA)
Major Resistance: 76.85 (Triangle Top)
Summary: Strong technical bias with rising volatility and bullish momentum in support of uptrend in the near-term. Scope for test of 79 mark. Dips can be used to enter longs. Major weakness only below 200-DMA.


