


AUD/JPY chart - Trading View
Technical Analysis: Bias Bullish
GMMA Indicator
- Major trend is bullish
- Minor trend is neutral
Ichimoku Analysis
- Price action is above cloud on the daily charts and Chikou span is biased higher
- The pair is hovering around cloud top on the weekly charts and decisive break will propel the pair higher
Oscillators
- Stochs and RSI are biased higher
- RSI is above 50 and supports uptrend
Bollinger Bands
- Bollinger bands are narrow, suggest less volatility
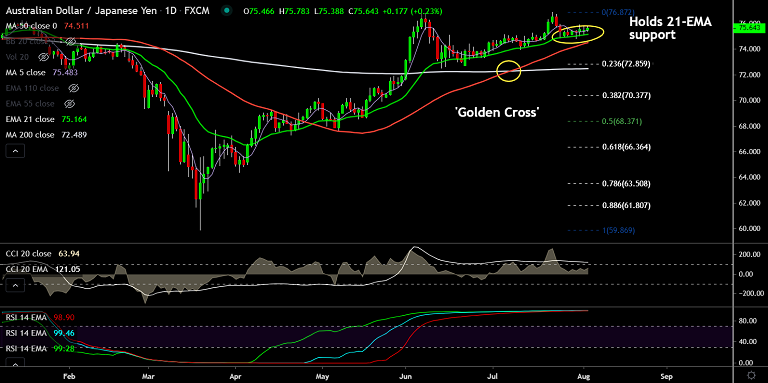
Major Support Levels: 75.17 (21-EMA), 74.51 (50-DMA)
Major Resistance Levels: 75.60 (110W EMA), 78.67 (61.8% Fib)
Summary: RBA left monetary policy unchanged with a 0.25% cash rate, decision-makers showed readiness for further policy accommodation. The pair trades with a slight bullish bias. Breakout at 110W EMA will buoy bulls. Scope for test of 61.8% Fib at 78.67.


