


 Goldman Predicts 50% Odds of 10% U.S. Tariff on Copper by Q1 Close
  U.S. Banks Report Strong Q4 Profits Amid Investment Banking Surge
  UBS Predicts Potential Fed Rate Cut Amid Strong US Economic Data
  Mexico's Undervalued Equity Market Offers Long-Term Investment Potential
  Stock Futures Dip as Investors Await Key Payrolls Data
  Wall Street Analysts Weigh in on Latest NFP Data
  China’s Growth Faces Structural Challenges Amid Doubts Over Data
  Gold Prices Fall Amid Rate Jitters; Copper Steady as China Stimulus Eyed
  Oil Prices Dip Slightly Amid Focus on Russian Sanctions and U.S. Inflation Data
  U.S. Treasury Yields Expected to Decline Amid Cooling Economic Pressures


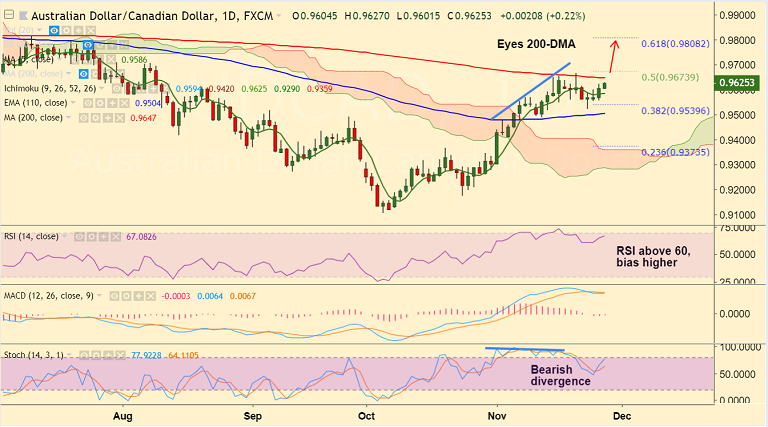
AUD/CAD chart on Trading View used for analysis
- AUD/CAD extends gains, trades 0.24% higher at 0.9627 at the time of writing.
- Price action is extending gains for the 4th straight session, trades shy of 200-DMA at 0.9647.
- Technical indicators support further gains. Stochs and RSI are biased higher, momentum bullish.
- The pair is in a near-term bull trend and breakout at 200-DMA could see further upside.
- That said, we evidence a bearish divergence on Stochs which dents scope for upside.
- We need a breakout at 200-DMA to see further gains. Scope then for test of 61.8% Fib at 0.98.
- On the flipside, rejection at 200-DMA could see test of 110-EMA. Violation there to see bullish invalidation.
Support levels - 0.9587 (5-DMA), 0.9539 (38.2% Fib), 0.9523 (Nov 23 low)
Resistance levels - 0.9647 (200-DMA), 0.9664 (Nov 21 high), 0.97
Recommendation: Watchout for break above 200-DMA to go long.
For details on FxWirePro's Currency Strength Index, visit http://www.fxwirepro.com/currencyindex.


