


 FxWirePro- Major Pair levels and bias summary
  Time to buy local: war fuel price shocks reveal the folly of a long food supply chain
  FxWirePro: EUR/NZD positions for another climb, eyes 2.0100 level
  FxWirePro- Major Crypto levels and bias summary
  FxWirePro- Major Crypto levels and bias summary
  NZDJPY Technical Outlook: Bearish Momentum Gains Traction as Kiwi Weakens
  FxWirePro- Major Crypto levels and bias summary
  FxWirePro- Major European Indices
  AUDJPY Under Pressure: Bearish Technicals Signal Further Downside for the Aussie
  Makemation: a Nollywood movie that shows AI in action in Africa


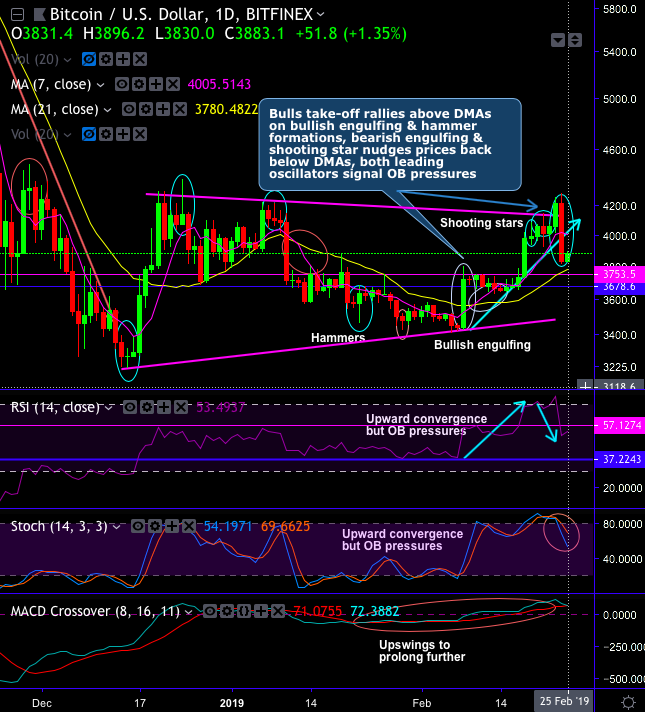
A glance at the underlying price and technical indications: Bitcoin (BTCUSD) bulls are attempting to extend its recent rallies after yesterday’s steep slumps with the bearish engulfing pattern at $3,831.30 levels.
Previously, the pair broke-out decisively the resistance zone of $3,675 - $3,750 mark against the US Dollar. BTCUSDforms spinning top at $4,008.80 levels to hamper previous bullish momentum. The price of this pair has surpassed $4k mark to extend bullish streaks yesterday and hit 6-weeks highs (refer daily chart). In this process, the minor trend of this pair has formed a wedge pattern, although the current price spikes above 7-DMAs with bullish crossovers, failure swings are observed at wedge resistance.
Upcoming Wednesday is the latest round of BTCK19 CME futures (contract started on December 3rd2018) expires.
The nature of futures contracts obligates that they are supposed to be settled on a predefined date, based on contractual terms.
All CME contracts will begin trading on this day and be settled on the last trade date in late May. CME bitcoin volumes have recently hit all-time highs so there has been some market speculation on the magnitude of their effect on Bitcoin prices. If CME traders expect a price bounce on Monday following the Sunday sell-offs, this may exaggerate price movements as leveraged longs are bought. Vice versa if sell-offs are expected to continue.
Currency Strength Index: FxWirePro's hourly BTC spot index is inching towards -95 levels (which is bearish), and hourly USD spot index has bearish index is creeping at -134 (bearish) while articulating (at 10:49 GMT).
For more details on the index, please refer below weblink: http://www.fxwirepro.com/currencyindex


