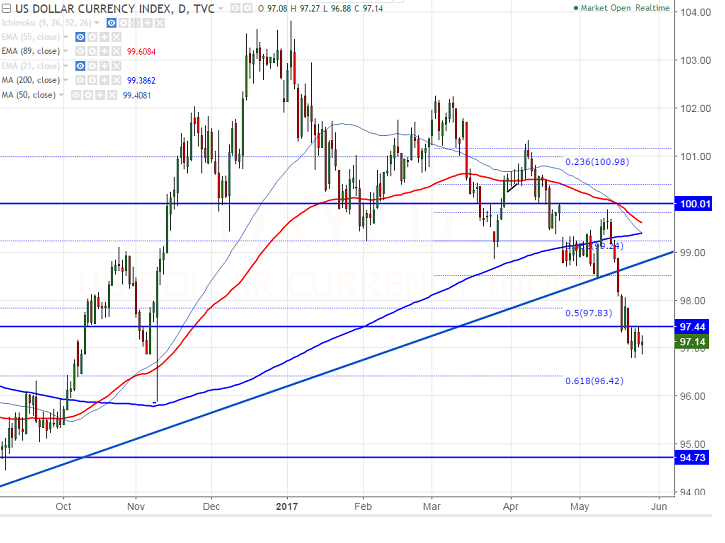
- US Dollar index shown minor weakness after jumping till 97.47. It is currently trading around 97.16.
- Short term trend is still weak as long as index not closing above 89 EMA in the weekly chart. The index has shown a huge decline from the high 103.82 and downside capped by 61.8% fibo at 96.40 and bearish continuation can be seen below that level.
- The near term resistance is around 97.45 (89 W EMA) and any close above will take the index till 98.60 (support turned into resistance)/ 99.25 (200 MA)/99.89.
- On the lower side, major near term support is around 96.40 (61.8% fibo) and any break below will drag the index till 95.91 (Nov 9th 2016 low)/95.
It is good to buy above 97.50 with SL around 97 for the TP of 98.60


NZDJPY: Sell the Rallies as Bears Guard 92 and Range Trade Persists
FxWirePro: AUD/USD gaining momentum for a move towards 0.6800 level
FxWirePro- Major Pair levels and bias summary
FxWirePro: EUR/CAD slips as firm oil price lift loonie despite soft GDP data
FxWirePro: USD/ZAR outlook weaker on renewed downside pressure
FxWirePro: EUR/NZD downside pressure builds, key support level in focus
FxWirePro- Major Crypto levels and bias summary
FxWirePro: USD/JPY extends falls as Japanese yen extends rally after hawkish BoJ minutes
FxWirePro: EUR/AUD slips following RBA minutes , plunge to test a key fibo grows
FxWirePro: USD/CNY hits 15-month low , scope for further downside
FxWirePro: GBP/USD runs out of steam but maintains bullish outlook
FxWirePro: USD/ZAR down trend loses steam, remains on bearish path 


