


 FxWirePro: Daily Commodity Tracker - 21st March, 2022
  Gold Prices Fall Amid Rate Jitters; Copper Steady as China Stimulus Eyed


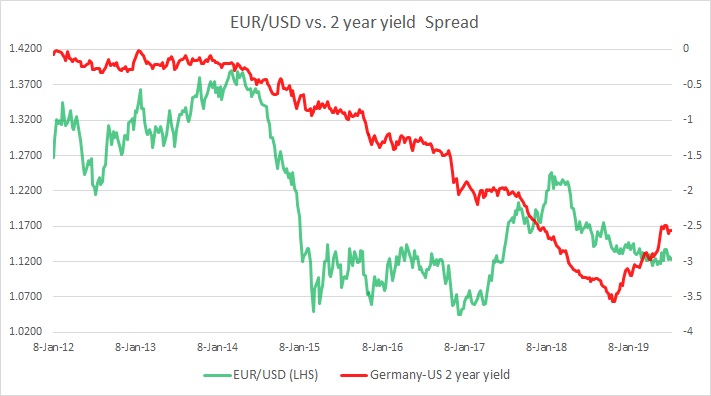
The chart above shows, how the relationship between EUR/USD and 2-year yield spread (U.S. - Eurozone) has unfolded since 2012. It is evident that these short rates have been a key influencing factor for the pair as policy divergence became evident since 2013.
- The chart clearly shows the close relationship between the yield spread and the exchange rate. Since December 2013, the yield spread declined from -0.2 percent area to -3.56 percent area by November 2018, and EUR/USD declined from 1.38 to 1.13 area.
- However, in our December review, we noted that since the second week of November, the yield spread has reversed course, and rose from -3.56 percent to -3.26 percent, which suggested that there might be a reversal in the exchange rate going ahead, should the spread continue its reversal.
- As expected the exchange rate reversed course and euro rose against the USD.
- In March, the spread has further narrowed to -2.98 percent in March, and the euro remains well-bid at 1.136 against the USD.
- In April, the spread remains broadly unchanged at -298 bps and the EUR/USD is continuing trading waters around 1.13 area.
- In May, the spread further narrowed to -290 bps but EUR/USD has further weakened to 1.12 area.
- In June, the spread further narrowed to -252 bps and the EUR/USD finally responding to the narrowing spread and moved higher to 1.132 area.
- In July, the spread is at -256 bps and the Euro is currently trading at 1.123 against the USD.


