


 Gold Prices Fall Amid Rate Jitters; Copper Steady as China Stimulus Eyed
  Best Gold Stocks to Buy Now: AABB, GOLD, GDX
  FxWirePro: Daily Commodity Tracker - 21st March, 2022


 - EconoTimes)


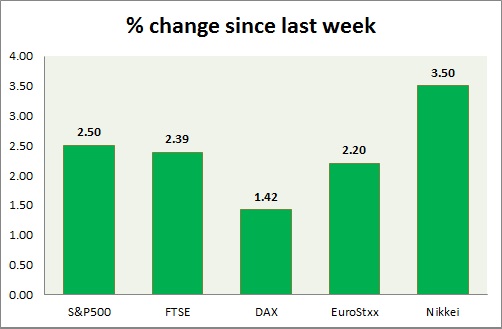
Equities are all red in today's trading. Kindly note all instruments mentioned here are CFDs, whose values might differ from cash or future traded. Performance this week at a glance in chart & table -
S&P 500 -
- S&P 500, rose sharply as oil price rose. S&P 500 broken key resistance zone. Today's range 1951-1971
- Active call - short side soured as S&P 500 broken key resistance around 1960 area, strategy would now be to buy at dips.
- S&P 500 future is currently trading at 1965. Immediate resistance lies at 1960 and support 1900, 1870.
FTSE -
- FTSE is up but unlike S&P, yet to break key resistance around 6160. Today's range 6060-6100.
- Active call - Sell FTSE100 @5890, with stop loss around 6160 area targeting 5200 area.
- FTSE is currently trading at 6080. Immediate support lies at 5500, 5200 and resistance 6150, 6350, 6820.
DAX -
- DAX is up more than 1% on global cue. Today's range 9400-9580.
- DAX is currently trading at 9500. Immediate support lies at, 9000 area and resistance at 10000, 10850 around.
EuroStxx50 -
- Stocks across Europe are up today.
- German DAX is up (+1.1%), France's CAC40 is up (+1.1%), Italy's FTSE MIB is up (+1.8%), Spain's IBEX is up (+1.5%).
- EuroStxx50 is currently trading at 2930, up by +1.1% today. Support lies at 2400 and resistance at 3060.
Nikkei -
- Nikkei cash closed marginally higher, however future is pointing to further gains. Today's range 16180-16470
- Nikkei is currently trading at 16380. Immediate support lies at 15000 and resistance at 16500, 18500.
|
S&P500 |
+2.50% |
|
FTSE |
+2.39% |
|
DAX |
+1.42% |
|
EuroStxx50 |
+2.20% |
|
Nikkei |
+3.50% |


