


 JPMorgan Lifts Gold Price Forecast to $6,300 by End-2026 on Strong Central Bank and Investor Demand


 - EconoTimes)


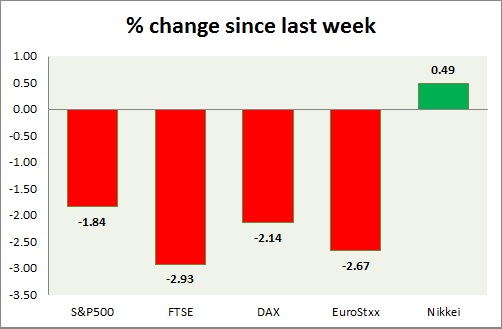
Equities are all red in today's trading. Kindly note all instruments mentioned here are CFDs, whose values might differ from cash or future traded. Performance this week at a glance in chart & table -
S&P 500
- S&P 500 is down sharply over rising risk aversion, however hasn't broken below interim support line yet. Today's range 2082-2057.
- S&P 500 future is currently trading at 2062. Immediate support lies at 2120 and resistance 2020.
FTSE
- FTSE is sharply down in line with global sell offs. Today's range 6300-6180.
- FTSE is currently trading at 6190. Immediate support lies at 5800, and resistance 6500, 6820.
DAX
- DAX is taking resistance at 200 day moving average. Today's range 10960-10730.
- DAX is currently trading at 10790. Immediate support lies at, 10,700, 9850 area and resistance at 11150, 11500 around.
EuroStxx50
- Stocks across Europe are down today.
- German DAX is down (-0.75%), France's CAC40 is down (-1.5%), Italy's FTSE MIB is down (-2.2%), Spain's IBEX is down (-2.3%).
- EuroStxx50 is currently trading at 3390, down by -1.2% today. Support lies at 3370, 3200 and resistance at 3550.
Nikkei
- Nikkei is best performer this week so far, but down today, in line with global stocks. Today's range 19730-19500
- Nikkei is currently trading at 19550, with support around 19500, 18600 and resistance at 20000, 20600.
|
S&P500 |
-1.84% |
|
FTSE |
-2.93% |
|
DAX |
-2.14% |
|
EuroStxx50 |
-2.67% |
|
Nikkei |
+0.49% |


