


 Bitcoin Retreats Toward Critical Support as Geopolitical Winds Shift
  FxWirePro- Major Crypto levels and bias summary
  Bitcoin Retreats as Geopolitical Tensions Flare: BTC/USD Dips Following Iran’s Rejection of Ceasefire
  Ethereum Trails Bitcoin’s Retreat: Key Support Levels in Focus
  Ethereum’s $2,200 Ceiling: Can Diplomatic Breakthroughs Dissolve the Bearish Resistance?


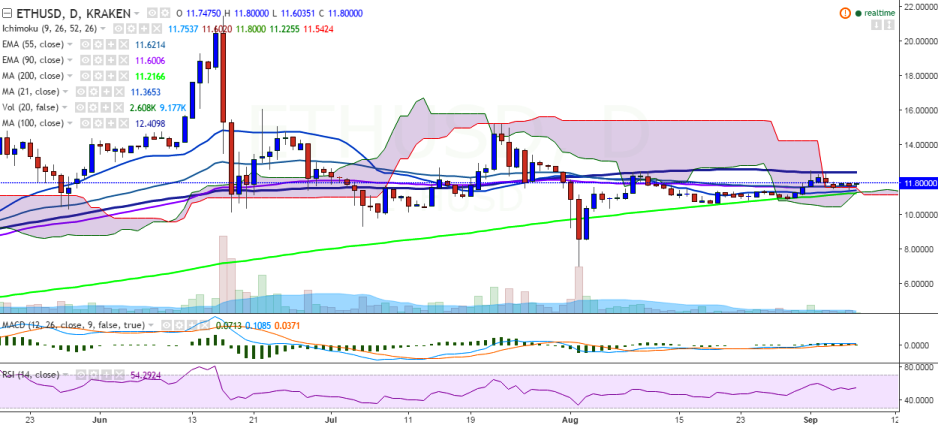
ETH/USD is trading flat on Wednesday and is trading above 90 EMA. It is currently trading at 11.80 levels at the time of writing (Kraken).
Long-term trend: Bullish
Ichimoku analysis of daily chart:
Tenkan Sen: 11.69
Kijun Sen: 11.60
Trend reversal: 11.59 (90 EMA)
“The 100-day MA is acting as a major resistance for the pair. ETH/USD has failed to break above this level and a consistent move beyond this level would confirm further upside”, FxWirePro said in a statement.
Major resistance is seen at 12.41 (100-day MA) and a break above would see the pair testing 13.47 (78.6% retracement of 15.23 and 7.00)/15.23 (July 22 high).
On the reverse side, support is likely to be found at 11.17 (200-day MA) and a break below would target 10.00 (psychological level) and then to 9.77(50% retracement of 7 and 12.54).

- News

- Economy

- Central Banks
- Investing
- Research
- Roundups
- Digital Currency
- Insights
- Technical Analysis
- Technology
- Business
- Law
- Health
- Nature
- Fintech
- Science
- Topic
- Opinions
- ©Econometrics LLC . All Rights Reserved.
ETH/USD trades rangebound, bullishness only above 100-day MA
Wednesday, September 7, 2016 10:36 AM UTC
Editor's Picks


- Market Data
Most Popular


