


 FxWirePro- Major Crypto levels and bias summary
  FxWirePro- Major Crypto levels and bias summary
  Bitcoin Surges Past $85,000 Amidst Rising Risk Appetite
  FxWirePro-24-Hour Crypto Category-Based Performance Dashboard
  FxWirePro- Major Crypto levels and bias summary


 Add as a preferred source on Google
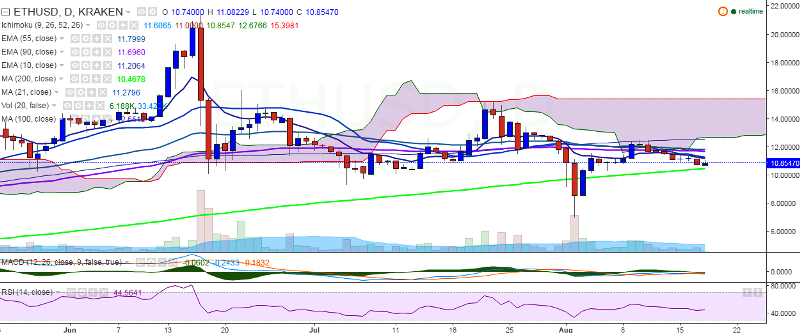
ETH/USD tried to recover its losses on Thursday and hit 11.08 levels so far in the day. However, it failed to hold its strength and currently trades at 10.85 levels at the time of writing (Kraken).
Ichimoku analysis of daily chart:
Tenkan Sen: 11.60
Kijun Sen: 11.11
Trend reversal: 11.71 (90 EMA)
On the upside, the pair faces immediate resistance at 11.37 levels(21-day MA) and a break above would see the pair testing 11.83 (55 EMA)/ 12.53 (100-day MA).
On the other side, the pair seems to have taken support near 200-MA and a break below this trend line would drag the pair to 9.09 (61.8% retracement of 7 and 12.49)/7.00. Short-term trend remains bearish for the pair.

- News

- Economy

- Central Banks
- Investing
- Research
- Roundups
- Digital Currency
- Insights
- Technical Analysis
- Technology
- Business
- Law
- Health
- Nature
- Fintech
- Science
- Topic
- Opinions
- ©Econometrics LLC . All Rights Reserved.
ETH/USD nears 200-day MA, break below confirms further downtrend
Thursday, August 18, 2016 11:04 AM UTC
Editor's Picks



- Market Data
Most Popular




