


 FxWirePro- Major Crypto levels and bias summary


 to fuel further upside - EconoTimes)


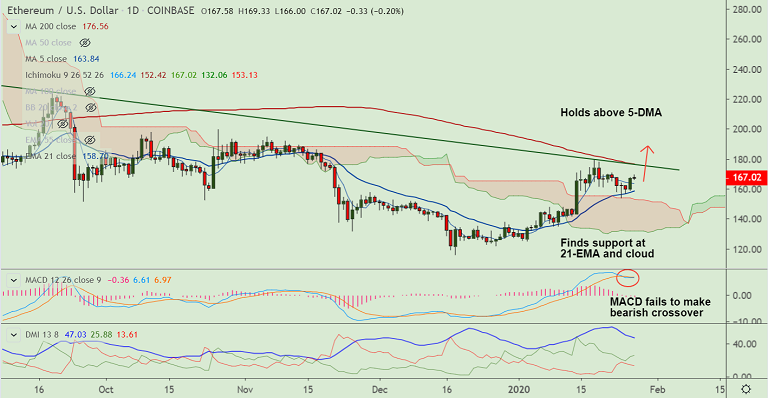
ETH/USD chart - Trading View
Exchange - Coinbase
Technical Analysis: Bias Bullish
GMMA Indicator: Major Trend - Turning Bullish; Minor Trend - Bullish
Overbought/ Oversold Index: Neutral
Volatility: High
Support: 163.86 (5-DMA); Resistance: 176.56 (converged 200-DMA and trendline)
ETH/USD was trading largely rangebound on the day with session high at 169.33 and low at 166.0.
The pair was trading 0.46% lower at 166.58 at around 06:40 GMT after closing 4.52% higher in the previous session.
Price action has bounced off 21-EMA support and weakness only on break below.
Technical indicators are turning bullish again. The pair has retraced above 200H MA.
The pair is on track to retest 200-DMA at 176.56. Decisive break above will propel the pair higher.
Next major resistance lies at 55W EMA at 196.69 ahead of 110W EMA at 208.79 and then 38.2% Fib at 211.08.
Failure at 200-DMA and break below 21-EMA support negates near-term upside.


