


DASH/USD chart - Trading View
Exchange - Kraken
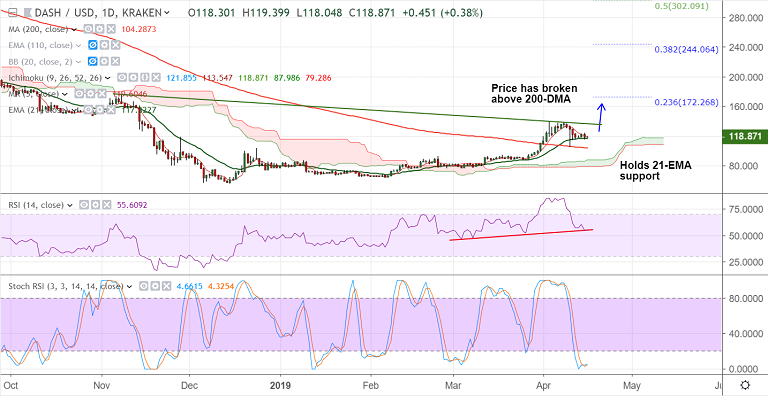
Support: 117.36 (21-EMA); Resistance: 135 (trendline)
Technical Analysis: Bias Turning Bullish
- DASH/USD is trading above 200-DMA (last in Mar 2018)
- Short-term group of averages moves above the longer-term group in 'Gruppy Multiple Moving Average' indicator suggesting a possible shift in trend
- Price action on daily charts is holding support at 21-EMA (currently at 117.34)
- Break above 5-DMA with a turn in the direction could see minor upside till 135 (trendline)
- Slip below 21-EMA could see weakness till 200-DMA. Violation at 200-DMA negates bullish bias
For details on FxWirePro's Currency Strength Index, visit http://www.fxwirepro.com/currencyindex.

- News

- Economy

- Central Banks
- Investing
- Research
- Roundups
- Digital Currency
- Insights
- Technical Analysis
- Technology
- Business
- Law
- Health
- Nature
- Fintech
- Science
- Topic
- Opinions
- ©Econometrics LLC . All Rights Reserved.
Crypto Technicals: DASH/USD holds 21-EMA support; On verge of upside resumption?
Tuesday, April 16, 2019 10:22 AM UTC
Editor's Picks


- Market Data
Most Popular


