


 Nasdaq Proposes Fast-Track Rule to Accelerate Index Inclusion for Major New Listings


 - EconoTimes)


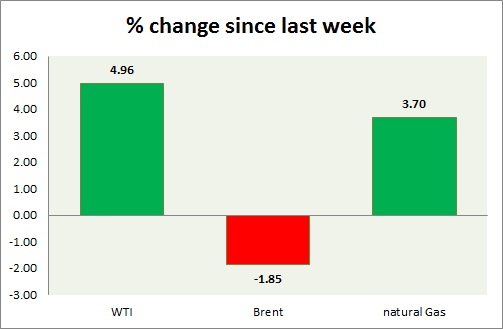
After last week's dismal performance the energy segment once again facing strong selling pressure across board. Prices fell once again after last night's brief rise. Performance this week at a glance in chart & table -
- Oil (WTI) - WTI is failing to gain above $50 as supply glut continue to weigh on price. The price is expected to continue sideways as traders wait for the next push. Inventory data tomorrow could provide such. WTI is currently trading at $49.8/ barrel, up 0.40% for the day. Immediate support lies at 48 and resistance at 54.
- Oil (Brent) - Brent is the worst performer this week so far but spreads gained ground after sharp sell-off yesterday. Brent price struggling to keep above $60/barrel as concern rises over supply increase from Libya and Iran. Brent-WTI spread is and currently trading at $11. Brent is trading at $61.2/barrel, up 1.8% for the day. Immediate support lies at 58 & resistance at 63.
- Natural Gas - Record cold in the eastern part of the US failed to keep the price buoyant as it slipped further to $2.64/mmbtu in intra day trading. The price is currently trading at $2.7/mmbtu. Immediate support lies at 2.65, 2.56 & resistance at 2.82. Prices could decline over the summer and once the support at $2.55 breaks down it could move even below $2/mmbtu.
|
WTI |
1.51% |
|
Brent |
-1.58% |
|
Natural Gas |
0.15% |


