


 BTC Flat at $89,300 Despite $1.02B ETF Exodus — Buy the Dip Toward $107K?
  Elon Musk’s Empire: SpaceX, Tesla, and xAI Merger Talks Spark Investor Debate
  FxWirePro- Major Crypto levels and bias summary
  JPMorgan Lifts Gold Price Forecast to $6,300 by End-2026 on Strong Central Bank and Investor Demand


 - EconoTimes)


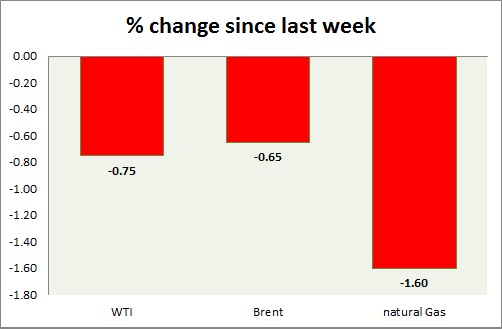
Energy pack is in red today. Weekly performance at a glance in chart & table.
Oil (WTI) -
- WTI is testing key level at $50/barrel.
- $54 area proved to be crucial resistance. Today's range $51.6-50.4
- WTI is likely to fall towards $42 area, once $50 support gets broken.
- WTI is currently trading at $50.4/barrel. Immediate support lies at $50 and resistance at $54
Oil (Brent) -
- Brent is treading water, supported by North Sea outage.
- Brent-WTI spread flat today, currently trading at $6.3/barrel.
- Target has reached around $55/barrel, and next target is around $51/barrel.
- Brent is trading at $56.7/barrel. Immediate support lies at $55 area and resistance at $59/60 region.
Natural Gas -
- Natural gas bulls retreated further after failing to clear resistance around $2.95/mmbtu area.
- A break above $2.95 area would push prices to first target of $3.1/mmbtu. However a failure would push prices lower.
- Bullish Doji, in weekly chart remains in focus. However resistance at $2.95 is quite strong.
- Natural Gas is currently trading at $2.83/mmbtu. Immediate support lies at $2.55, $2.45 area & resistance at $2.95, $3.04, $3.32.
|
WTI |
-0.75% |
|
Brent |
-0.65% |
|
Natural Gas |
-1.60% |


