


 Nasdaq Proposes Fast-Track Rule to Accelerate Index Inclusion for Major New Listings
  Elon Musk’s Empire: SpaceX, Tesla, and xAI Merger Talks Spark Investor Debate


 - EconoTimes)


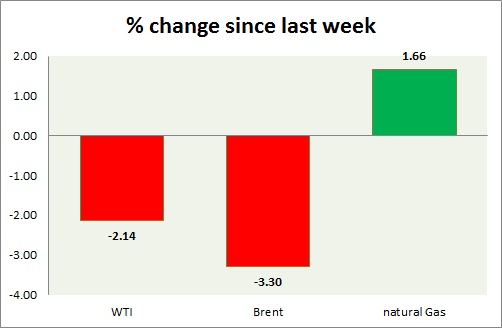
Oil gave up and gas gained. Weekly performance at a glance in chart & table.
Oil (WTI) -
- WTI gave up further gains amid stronger Dollar. Middle East tension is failing to create much upside momentum.
- WTI carved bearish doji in weekly chart and very bearish grave stone doji in daily chart. Further downside remains open if doji high is not taken out. RSI is also around 50 level resistance.
- WTI is currently trading at $58.6/barrel. Immediate support lies at $55-54.6, $51.2-50 and resistance at $63-$65. $58 may continue to provide interim support.
Oil (Brent) -
- Brent is slightly better performer today than WTI, however going down in line
- Brent-WTI spread gained around 20 cents, currently trading at $6.1/barrel.
- Brent is trading at $64.7/barrel. Immediate support lies at $63.7-63.2, 61.8-61.4 area and resistance at $ 70 region.
Natural Gas -
- Natural gas gained further ground as demand remains high. Traded as high as 3.11/mmbtu
- Price target for bulls are coming close to $3.5/mmbtu, should support at $2.45 holds. Averaging it as low as possible would diminish risk.
- Natural Gas is currently trading at $3.06/mmbtu. Immediate support lies at $2.78 area & resistance at $3.32.
|
WTI |
-2.14% |
|
Brent |
-3.30% |
|
Natural Gas |
+1.66% |


