


 Elon Musk’s Empire: SpaceX, Tesla, and xAI Merger Talks Spark Investor Debate
  FxWirePro- Major Crypto levels and bias summary


 - EconoTimes)


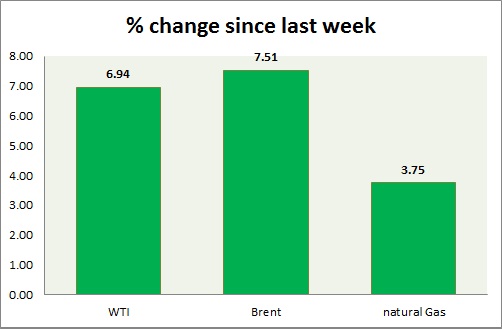
Energy segment is the best performer this week, breaking important resistance. Weekly performance at a glance in chart & table
Oil (WTI) -
- WTI has broken above three month high which in itself sign of strong buying interest.
- Bulls might once again move to test $54-54.5 area. Breakout of the area would push prices higher towards $60 as initial target area. $63-65 area comes next. Expect higher volatilities.
- WTI is currently trading at $55.3/barrel, down -1.8% today. Bulls were rejected at $56.5 area. Immediate support lies at $51.2-50, $47.5-47 and resistance at $54-54.5, and $58.9-59.7.
Oil (Brent) -
- Brent is the best performer this week, taken out resistance around $60. Further appreciation likely. However resistance area remains close.
- Brent-WTI spread widened over late night trading, currently trading at $7/barrel. However as of now, Brent is much closer to Resistance area than WTI, which might squeeze spread.
- Brent is trading at $62.3/barrel. Immediate support lies at $58-57 area and resistance at $ 62.6-64 region.
Natural Gas -
- Natural gas bounce back gathered further pace today, after price traded close to initial target area of $2.44/mmbtu. Broader downtrend remains intact, despite bounce back.
- Natural Gas is currently trading at 2.60/mmbtu. Immediate support lies at $2.12 area & resistance at $2.60, 2.66, 2.71.
|
WTI |
+6.94% |
|
Brent |
+7.51% |
|
Natural Gas |
+3.75% |


