


 Nasdaq Proposes Fast-Track Rule to Accelerate Index Inclusion for Major New Listings
  JPMorgan Lifts Gold Price Forecast to $6,300 by End-2026 on Strong Central Bank and Investor Demand


 - EconoTimes)


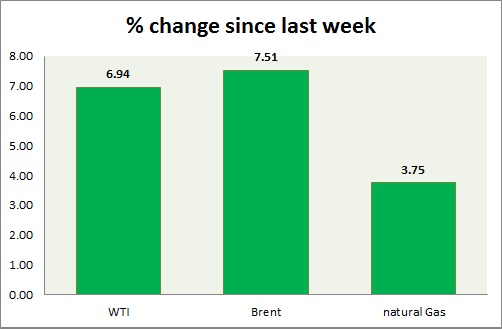
Energy segment is once again hit by selling as prices failed to break above key resistance last week. Weekly performance at a glance in chart & table
Oil (WTI) -
- WTI fell close to -1.5% today, as supply remains of greater concern than Middle East tension.
- WTI might continue to tread waters until further clarity appears.
- Bulls are retracing after reaching first bullish target of $51 and just short of second target at $54 last week.
- Target to the downside is coming around $45.
- WTI is currently trading at $48.25/barrel. Immediate support lies at 47.5-47, 44-43.7 and resistance at 51.7-52.1, 54-54.5, 58.7-59.2.
Oil (Brent) -
- Brent fell but performed worse than WTI.
- Brent-WTI spread narrowed after since last week, trading at $ 7.2/barrel, might go further down if Iran deal come out successful.
- Brent is trading at $55.4/barrel, down -1.35% today. Bias is downwards. Immediate support lies at 53 & resistance at 59.6-60.
Natural Gas -
- Natural gas is trading near range low. Price is lacking direction.
- Price pattern suggests that prices might drop down towards $2.44/mmbtu.
- Approaching summer is weighing on price, however talks of higher intake by power producers has kept the price supported.
- Natural Gas is currently trading at 2.65/mmbtu, flat today. Immediate support lies at 2.65, 2.55 & resistance at 2.74, 2.91, and 3.02.
|
WTI |
-0.12% |
|
Brent |
-1.20% |
|
Natural Gas |
-0.08% |


