


 FxWirePro: Daily Commodity Tracker - 21st March, 2022


In the past two mega events, Scottish referendum and UK election polls have failed to paint closer to accurate picture in UK, but we have little option but to look at the polls again to gauge the mood of people surrounding European referendum. Only piece of good news is that after their two successive failure pollsters are giving extra efforts to be close to correct this time around.
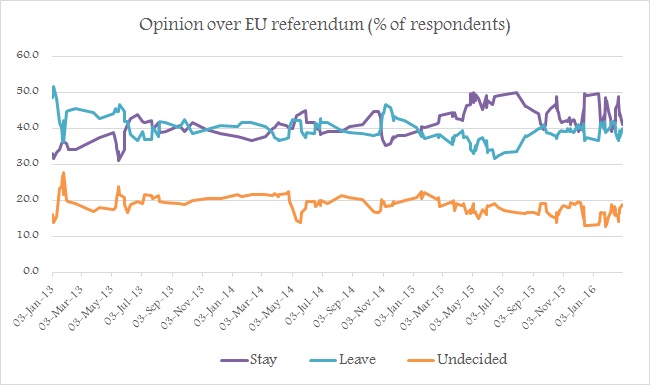
To have a feel of public mood, we have looked at numbers dating back to as early as 2011. Latest four polls average graph dating back from 2013 is shown above.
- One trend is quite visible, in time of calm and prosperity people are leaning towards stay and preferring to leave with storm in the horizon. Latest migrant crisis in Europe has taken its toll over people's opinion, which is quite visible in the graph and poll numbers.
- Another key point to note is that quite large portion of people still remains undecided and they are once again will be key in final decision, since the gap is quite narrow among those made up their mind to stay or leave.
- According to the average of polls dating back to as early as 2010, 41.5% people are willing to vote to stay, 40% preferring to leave and rest 18.5% still remain undecided.
With lot at stake, expect both exit and stay group to run quite a campaign to influence those remaining undecided. We at FxWirePro fundamental will keep you updated under the series.


