


 FxWirePro- Major European Indices
  FxWirePro: GBP/USD drops towards 1.3350 level, heads deeper into bear territory
  Bitcoin Teeters Near USD 70,000 as USD 245 Million Liquidation Wave Rocks Crypto Markets
  FxWirePro -Major European Indices
  FxWirePro- Woodies Pivot(Major)
  FxWirePro: USD/JPY edges up, remains on front foot
  FxWirePro: EUR/AUD falls below 1.6200 level, plunge to test a key fibo grows
  Euro's Ascent: EURJPY Bulls Eye 186.00 as Yen Weakness Persists
  FxWirePro: AUD/USD softens slightly, but remains bid overall
  Bitcoin’s Tug-of-War: Institutional Inflows Battle Technical Resistance at USD 72,500


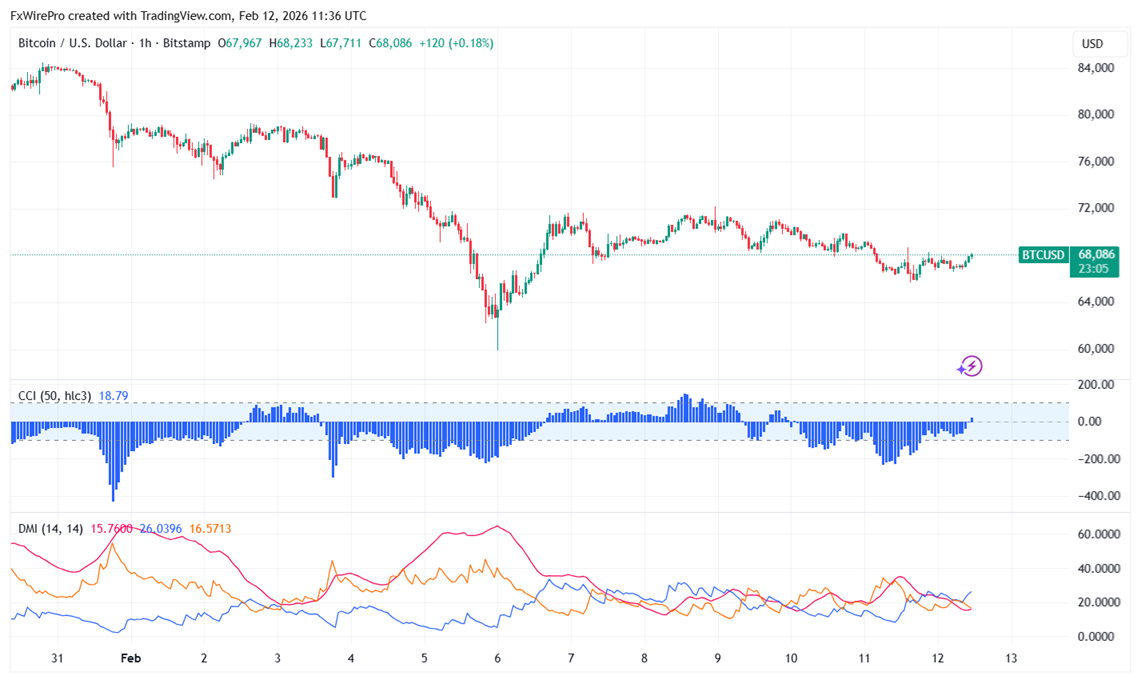
BTCUSD showed a minor pullback from the temporary bottom of $65720 made yesterday. It hits an intraday high of $68233 and is currently trading around $68019.
|
Technicals |
CMP -$68015 |
Trend |
|
|
1- Hour chart |
Value |
|
|
|
55 EMA |
$67895 |
CMP > 55 EMA |
Bullish |
|
200- EMA |
$70564 |
CMP is less than 2200- EMA |
Bearish |
|
365- EMA |
$74252 |
CMP < Value |
Bearish |
In the 4- hour chart, the pair is trading well below short term - $71057 (55-EMA) and long-term- $84992 (365- EMA) and $80396 (200-EMA).
Major support- $64000/$60000/$52500/$50000. Minor bullishness only above $72500.
|
Momentum indicator (1-hour chart) |
Inference |
Value |
|
CCI(50) |
Neutral |
|
|
ADX |
Bullish |
Strength - 15.84. It should cross above 20 level for bullish trend confirmation |
It is good to sell on rallies around $70000 with SL around $74250 for a TP of $60000.


