


 FxWirePro: NZD/USD edges higher ahead of Jackson hole warsh speech
  FxWirePro: USD/JPY trades flat ahead of Warsh's policy signals
  FxWirePro: GBP/AUD dips below 1.9000 level , vulnerable to more downside
  NZDJPY Faces Downward Pressure as 95.40 Resistance Holds Firm
  Bitcoin Eyes $90K as $3B ETF Inflow Streak Overpowers Hawkish Fed
  FxWirePro: USD/JPY dips as Yen firms on BOJ rate-hike bets
  FxWirePro: USD/CNY dips as dollar weakens on US-Iran escalation
  FxWirePro: USD/CNY hovers around 3-1/2 years low, Outlook bearish
  AUD/JPY Faces Downside Pressure Amidst Australian Dollar Weakness
  Bitcoin Surges Past $79,000: ETF Inflows and Technicals Signal Strong Bullish Momentum


 Add as a preferred source on Google
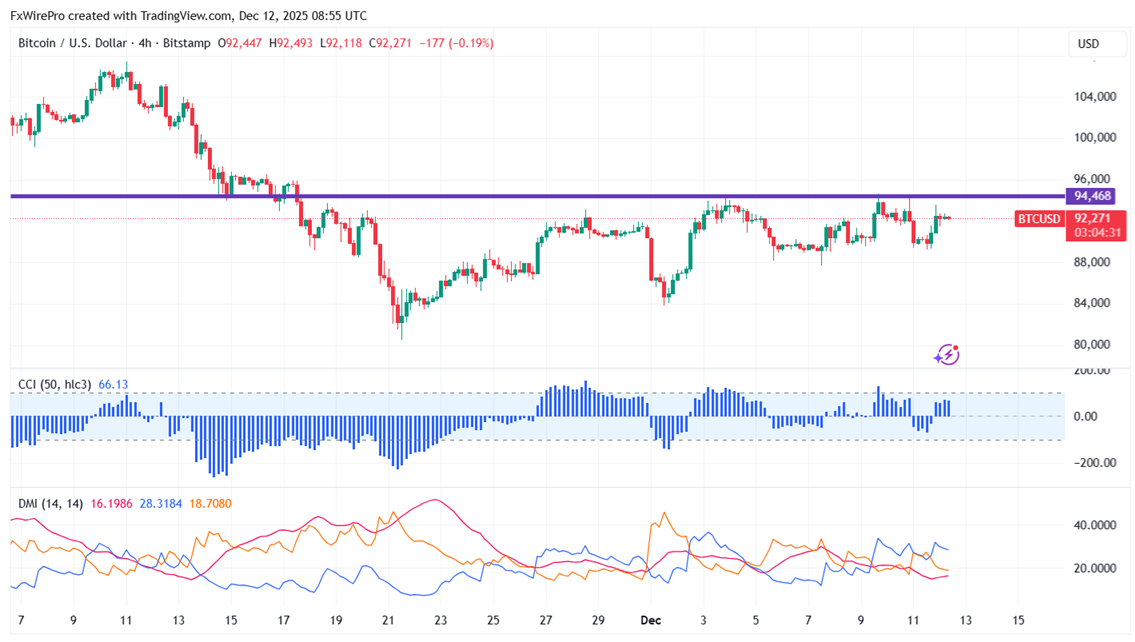
BTCUSD trades in a narrow range despite the Fed rate cut. It hit a high of $93652 yesterday, and at the moment, it is around $92235.
Oscillators and moving averages to forecast the trend of BTCUSD
CMP- $92234
EMA (4-hour chart)
55-EMA- $91068
200-EMA- $93691
365-EMA- $98186. The pair trades above short and below long term moving average.
Major Support - $90000. Any breach below $90000 will drag the pair down to $86000/$83000/$80000.
Major Resistance - $95000. Any break above $95000 confirms minor bullishness, a jump to $95415/$97400/$98500/$10000.
Indicators (4-hour chart)
CCI(50)- Bullish
ADX- Neutral
5. Investment Strategy for BTCUSD
It is good to buy on dips around $90000 with a stop loss around $86000 for target profits of $100000/$107000.







