


 Ethereum’s Recovery Phase: ETH Reclaims USD 2,050 Amid Technical Tug-of-War
  FxWirePro: GBP/USD drops towards 1.3350 level, heads deeper into bear territory
  FxWirePro: USD/ZAR uptrend resumes rise toward key fibo
  FxWirePro- Woodies Pivot(Major)
  FxWirePro: GBP/USD dips after US CPI data, key support level in focus
  FxWirePro- Major Crypto levels and bias summary
  Euro's Ascent: EURJPY Bulls Eye 186.00 as Yen Weakness Persists
  FxWirePro- Major Crypto levels and bias summary
  FxWirePro:EUR/USD slips as oil supply and conflict fears persist
  G7 Oil Blitz Ignites Ethereum Recovery: ETHUSD Reclaims USD 2,000 Threshold
  Bitcoin Teeters Near USD 70,000 as USD 245 Million Liquidation Wave Rocks Crypto Markets
  FxWirePro: GBP/NZD topside capped, sellers still hold the advantage


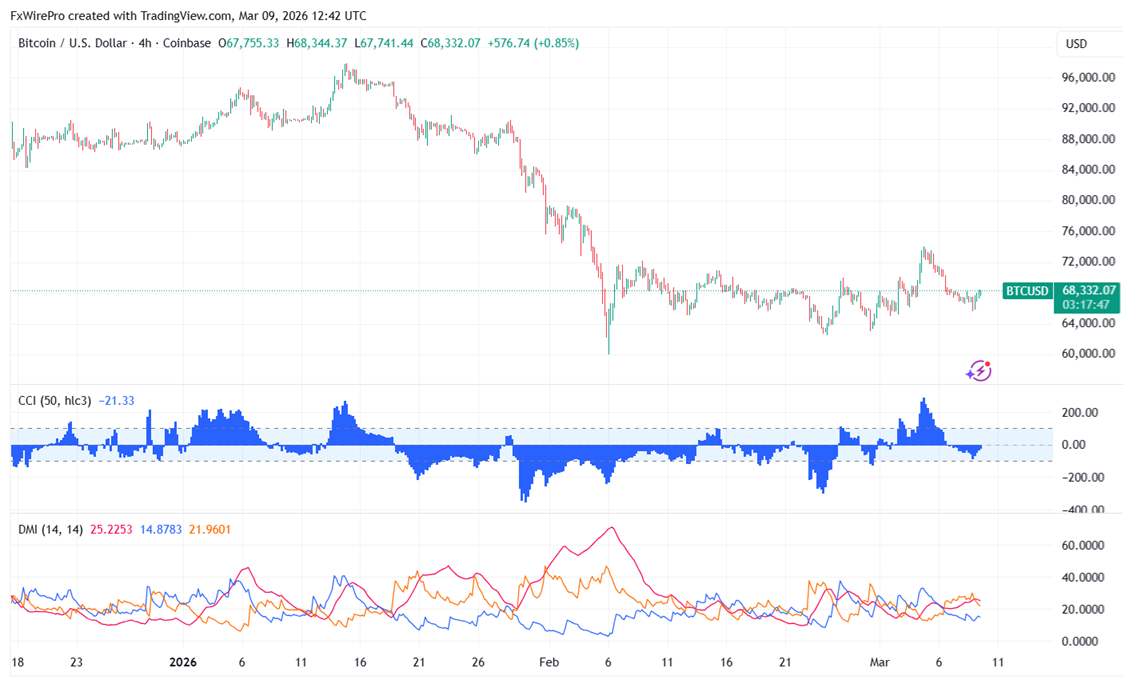
As crude oil prices rose, BTCUSD faded its radiance. It is presently trading around $68236 and has reached a low of $65618.
|
Technicals |
CMP -$68187 |
Trend |
|
|
4- Hour chart |
Value |
|
|
|
55 EMA |
$68217 |
CMP > 55 EMA |
Bullish |
|
200- EMA |
$70596 |
CMP <200- EMA |
Bearish |
|
365- EMA |
$75296 |
CMP < 365 EMA |
Bearish |
Major support- $64000/$60000/$52500/$50000. Minor bullishness only above $72500.
|
Momentum indicator (4-hour chart) |
Inference |
Value |
|
CCI(50) |
Bullish |
97.60 |
|
ADX |
Bullish |
Strength increased from 14.59 to 16.25 |
It is good to buy on dips around $67000 with SL around $64000 for a TP of $80000.


