


 FxWirePro- Major Crypto levels and bias summary
  NZDJPY: Bearish Outlook Persists as 92 Resistance Holds Firm
  FxWirePro- Major Pair levels and bias summary
  FxWirePro: USD/ZAR retreats slightly but trend is still bullish
  FxWirePro- Major Pair levels and bias summary
  AUDJPY Trapped in Narrow Range: Bearish Technicals Suggest Downside Risk
  Bitcoin Sheds $491M in ETF Outflows and Retreats Below $64K; Sellers Reload for $50K
  FxWirePro: EUR/AUD up trend gains momentum but hurdles ahead
  EURJPY Consolidates Above Key EMAs: Mixed Indicators Suggest Cautious Optimism for Traders


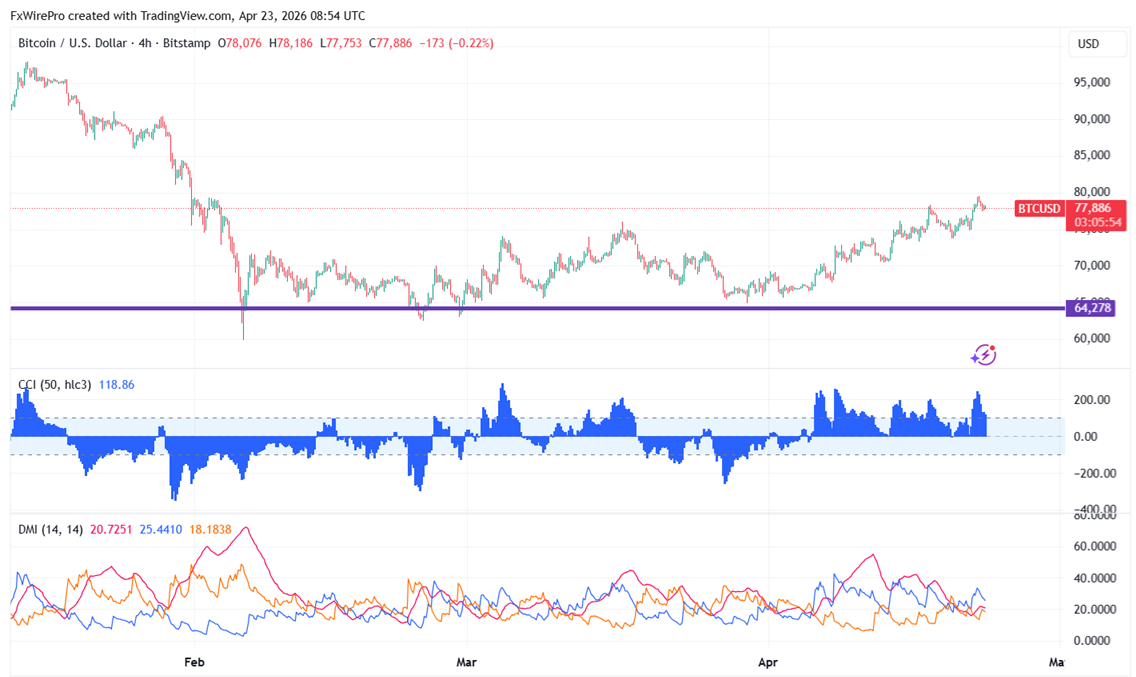
Before the second round of peace negotiations between the US and Iran, BTCUSD is trading flat. Yesterday, it reached $79500; now it trades at approximately $77894.
|
Technicals |
CMP -$77894 |
Trend |
|
|
4- Hour chart |
Value |
|
|
|
55 EMA |
$75644 |
CMP> 55 EMA |
Bullish |
|
200- EMA |
$72531 |
CMP >200- EMA |
Bullish |
|
365- EMA |
$72678 |
CMP< 365 EMA |
Bullish |
Major support- $74800/$74000/$73290/$70000/$67000/$64000/$60000. Minor bullishness only above $78500. Any break above targets $80000/$85890/$90000.
|
Momentum indicator (4-hour chart) |
Inference |
Value |
|
CCI(50) |
Bullish |
131.96 |
|
ADX |
Neutral |
|
It is good to buy on dips around $75000 with SL around $724000 for a TP of $84490.


