


 FxWirePro- Major Crypto levels and bias summary
  Bitcoin Retreats as Geopolitical Tensions Flare: BTC/USD Dips Following Iran’s Rejection of Ceasefire
  Ethereum Trails Bitcoin’s Retreat: Key Support Levels in Focus
  Bitcoin Retreats Toward Critical Support as Geopolitical Winds Shift
  FxWirePro- Major Crypto levels and bias summary
  Ethereum Retreats in Bitcoin’s Shadow: ETH/USD Tests Critical Support at USD 2,075


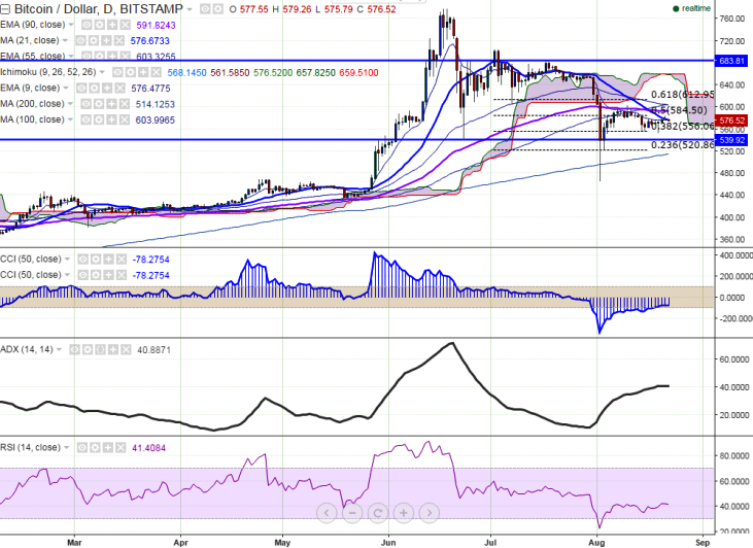
BTC/USD has once again recovered after making a low of $552. It is currently trading close to 21-day MA at $576.52 (Bitstamp).
Long-term trend: bullish
Ichimoku analysis (Daily chart):
Tenkan-Sen level: $571.14
Kijun-Sen level: $562.63
Trend reversal level - (90 EMA)-$592.16
“BTC/USD is facing minor resistance at $585 (50% retracement of $704.93 and $465) and break above that level confirms minor bullishness”, FxWirePro said in a statement.
Major resistance is around $585 (50% retracement of $704.93 and $465) and any break above targets $603 (Aug 10th 2016 high)/ 613 (61.8% retracement of $705 and $465). On the reverse side, short-term support is seen at $562 (daily Kijun-Sen) and any violation below targets $540 (38.2% retracement of $465 and $583)/$510.10 (200 day MA).

- News

- Economy

- Central Banks
- Investing
- Research
- Roundups
- Digital Currency
- Insights
- Technical Analysis
- Technology
- Business
- Law
- Health
- Nature
- Fintech
- Science
- Topic
- Opinions
- ©Econometrics LLC . All Rights Reserved.
BTC/USD hovers around 21-day MA, jump till 603 likely
Monday, August 22, 2016 7:31 AM UTC
Editor's Picks


- Market Data
Most Popular


