


 Ethereum Steady Above USD 2,000: ETH Tracks Bitcoin’s Lead as Bulls Eye a USD 2,770 Breakout
  Ethereum Trails Bitcoin’s Retreat: Key Support Levels in Focus
  Ethereum’s $2,200 Ceiling: Can Diplomatic Breakthroughs Dissolve the Bearish Resistance?
  BTCUSD Coils in Tight Range: Will Geopolitical Stability Trigger a Breakout Toward $80,000?
  FxWirePro- Major Crypto levels and bias summary


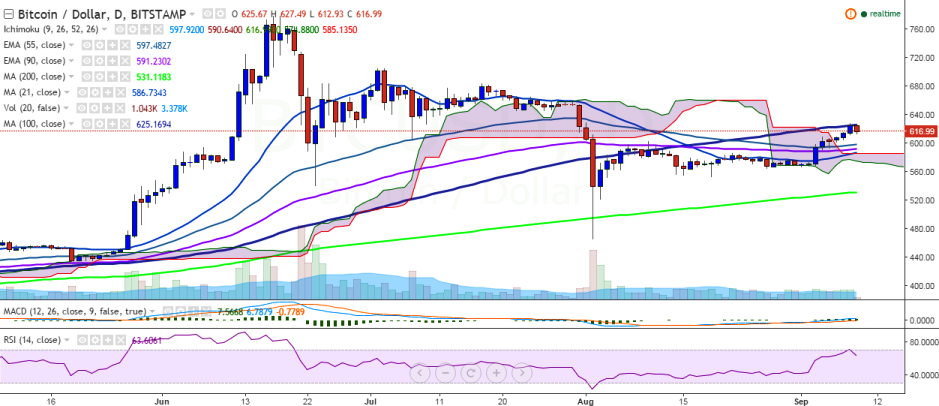
BTC/USD is trading in the red after hitting 100-day MA. The pair hit a fresh high of 628.98 levels on Thursday and failed to hold its strength above 100 DMA. It is currently trading at 615.22 levels (Bitstamp).
Long-term trend: Bullish
Short-term trend: Bullish
Ichimoku analysis of daily chart:
Tenkan Sen: 597.92
Kijun Sen: 590.64
Trend reversal: 590.65 (90 EMA)
“100-day MA is acting as a major resistance to the pair and only a consistent break above this level would confirm further uptrend” FxWirePro said in a statement.
On the upside, major resistance is seen at 624.36 (100-day) and a break above would target 653.69 (78.6% retracement of 704.99 and 465.28)/ 705 (July 3 high).
On the reverse side, support is seen at 590.65 (90 EMA), and a break below would see the pair falling to 547.13 (50% retracement of 465.28 and 628.98)/ 530.22 (200-day MA).

- News

- Economy

- Central Banks
- Investing
- Research
- Roundups
- Digital Currency
- Insights
- Technical Analysis
- Technology
- Business
- Law
- Health
- Nature
- Fintech
- Science
- Topic
- Opinions
- ©Econometrics LLC . All Rights Reserved.
BTC/USD faces strong resistance at 100-day MA, close above confirms bullishness
Friday, September 9, 2016 7:29 AM UTC
Editor's Picks


- Market Data
Most Popular


