


 Ethereum’s $2,200 Ceiling: Can Diplomatic Breakthroughs Dissolve the Bearish Resistance?
  Ethereum Retreats in Bitcoin’s Shadow: ETH/USD Tests Critical Support at USD 2,075
  Bitcoin Retreats Toward Critical Support as Geopolitical Winds Shift
  BTCUSD Coils in Tight Range: Will Geopolitical Stability Trigger a Breakout Toward $80,000?
  FxWirePro- Major Crypto levels and bias summary
  FxWirePro- Major Crypto levels and bias summary
  Ethereum Trails Bitcoin’s Retreat: Key Support Levels in Focus


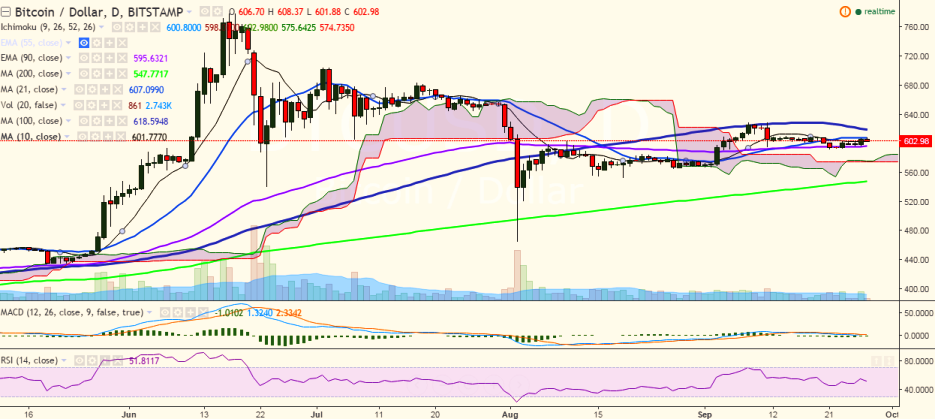
BTC/USD ran into resistance at 607.34 (21 DMA) on Monday and has failed to break above this level. It is currently trading slightly lower at 602.20 (Bitstamp).
Long-term trend: Bullish
Short-term trend: Bullish
Ichimoku analysis of daily chart:
Tenkan Sen: 600.80
Kijun Sen: 597.92
Trend reversal: 595.46 (90 EMA)
“The pair has turned red after facing resistance at 21-DMA and has been trading above 10-DMA so far in the day. A break above 610 levels would see a slight jump in the pair, while bullishness could be confirmed only above 628”, FxWirePro said in a statement.
BTC/USD faces immediate resistance at 607.34 (21-day MA) and a break above would target September 11 high of 628 (September 11 high)/651.79 (161.8% retracement of 628.99 and 592.10).
On the reverse side, support is seen at 595.46 (90 EMA) and a break below would target 546.85 (200-day MA)/527 (61.8% retracement of 465.28 and 628.99).

- News

- Economy

- Central Banks
- Investing
- Research
- Roundups
- Digital Currency
- Insights
- Technical Analysis
- Technology
- Business
- Law
- Health
- Nature
- Fintech
- Science
- Topic
- Opinions
- ©Econometrics LLC . All Rights Reserved.
BTC/USD faces resistance at 21-DMA, bullishness only above 628
Tuesday, September 27, 2016 6:54 AM UTC
Editor's Picks


- Market Data
Most Popular


