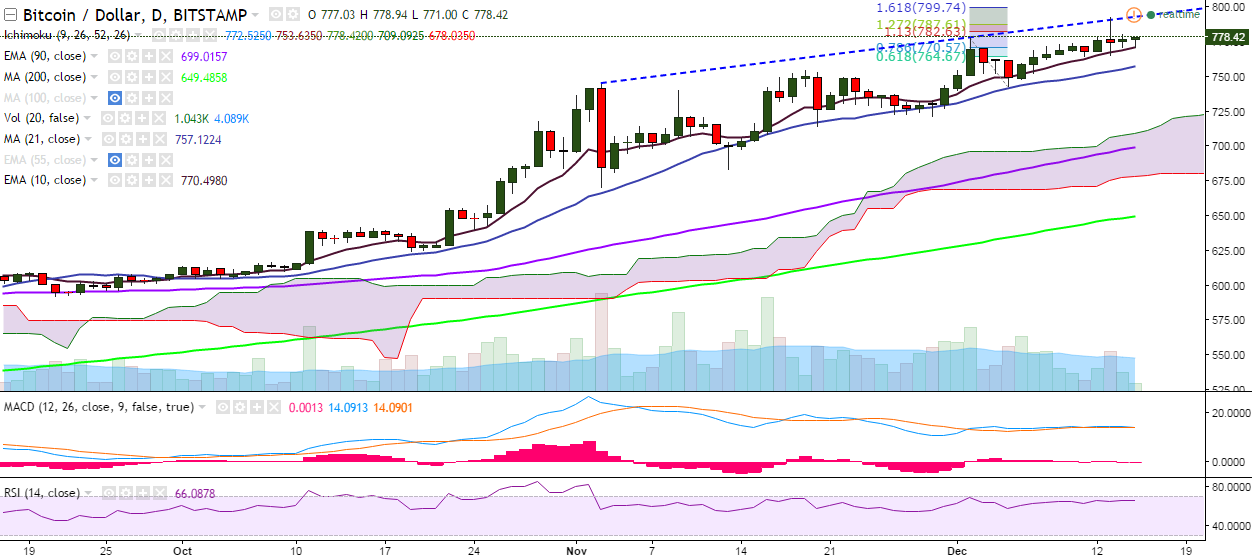
BTC/USD is facing strong resistance at 782.63 (113% retracement of 778.07 and 743) and is currently trading at 777 levels (Bitstamp).
Long-term trend: Bullish
Short-term trend: Bullish
Ichimoku analysis of daily chart:
Tenkan Sen: 770.63
Kijun Sen: 753.63
Trend reversal: 697.23 (90 EMA)
On the upside, a consistent break above 782.63 levels would target 792 (trend line joining 745.19 and 778.07). Further strength would see the pair testing 799.74 levels (161.8% retracement of778.07 and 743) /819 (113% retracement of 778.85 and 465.28).
On the downside, the pair has taken support near 768.73 (10-EMA) and a break below would drag it to 755 (21-day MA)/743 (December 05 low)/714 (November 20 low).
BTC/USD capped at 113% fib, break above trend line resistance could see further upside

Thursday, December 15, 2016 10:59 AM UTC
Editor's Picks
- Market Data
Most Popular


 FxWirePro- Major Crypto levels and bias summary


