


 Relief Rally Extends to 112.75, but AUDJPY EMA Structure Favors Selling
  GBPJPY Coil Tightens: Is a Bullish Break Above 215.60 Imminent?
  FxWirePro: EUR/ NZD uptrend loses steam, remains on bullish path
  BTC’s Bear Bounce: Sell the Rally Near $66K as Bears Target $59K–$52K Breakdown
  FxWirePro- Major Crypto levels and bias summary
  FxWirePro: USD/JPY gains above 160 level ahead of BOJ policy meeting


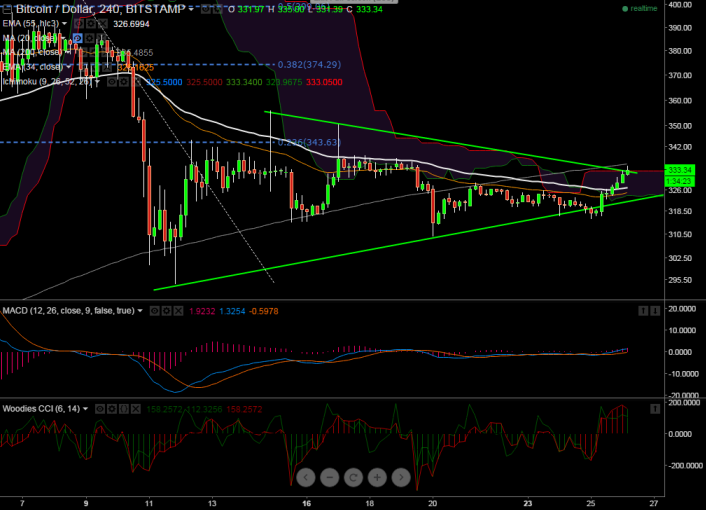
- BTC/USD has recovered from the low of $316 and jumped till $335. It is currently trading at $332
- The pair has broken minor trend line resistance $333 (trend line joining $356 and $350) but it should close above $336 (200 day 4 HMA) in 4 hour chart for further bullishness.
- Any close above $336 will take the pair to $350/$356. On the downside minor support is around $325 (55 day 4 HMA) and break below confirms minor trend reversal a decline till $316/$310 is possible.
It is good to buy at dips $331-$332 with SL around $324 for the TP of $340/$350.


