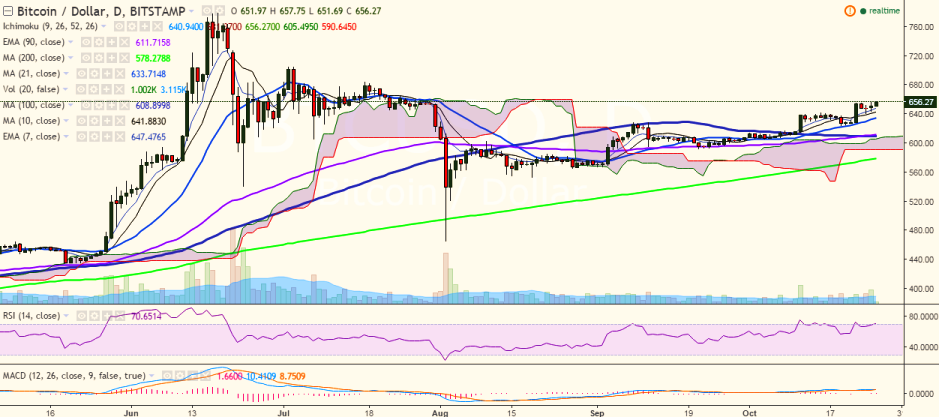
BTC/USD continues to hover around the previous high of 656 levels. It has hit 657.75 levels so far in the day and is currently trading at 656.80 levels (Bitstamp).
Long-term trend: Bullish
Short-term trend: Bullish
Ichimoku analysis of daily chart:
Tenkan Sen: 640.85
Kijun Sen: 630.36
Trend reversal: 610.71 (90 EMA)
On the upside, a consistent break above today’s high of 657.75 would target 665.89 (161.8% retracement of 656 and 640)/684.19 (July 17 high).
On the downside, support is seen at 640.15 levels (10-day MA) and any violation would drag it to 631.43 (21-day MA)/ 610.71 (90 EMA).
BTC/USD breaks above major resistance at 656, jump till 684 likely

Wednesday, October 26, 2016 7:25 AM UTC
Editor's Picks
- Market Data
Most Popular


 FxWirePro- Major Crypto levels and bias summary
  FxWirePro- Major Crypto levels and bias summary


