


 Bitcoin Pulls Back Amidst Geopolitical Tensions and ETF Outflows, Technicals Signal Caution
  FxWirePro: AUD/USD slips to hit three-month low,scope for further downside
  FxWirePro: EUR/AUD bullish outlook with scope to target 1.6700
  FxWirePro: USD/CAD loses momentum but bullish setup remains
  FxWirePro: NZD/USD snaps eight-day losing streak
  FxWirePro- Woodies pivot (Major)
  FxWirePro: USD/JPY steadies below 162.00 as Geopolitical risks keep dollar supported
  NZDJPY: Bearish Outlook Persists as 92 Resistance Holds Firm
  FxWirePro- Major Crypto levels and bias summary
  FxWirePro: GBP/NZD remains bullish as rally continues


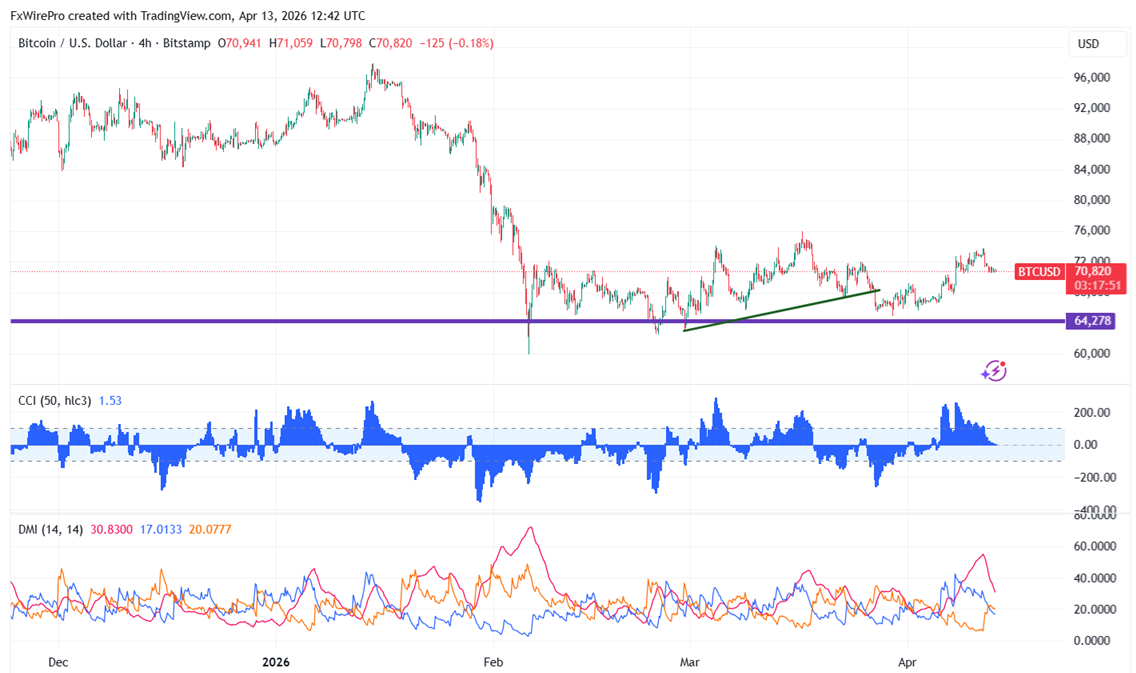
BTCUSD pared some of its gains as US and Iran negotiations failed. It peaked at $73832 on Apr 11th and is currently trading at about $70856.
|
Technicals |
CMP -$70856 |
Trend |
|
|
4- Hour chart |
Value |
|
|
|
55 EMA |
$70715 |
CMP> 55 EMA |
Bullish |
|
200- EMA |
$69873 |
CMP >200- EMA |
Bullish |
|
365- EMA |
$71504 |
CMP< 365 EMA |
Bearish |
Major support- $64000/$60000/$52500/$50000. Minor bullishness only above $73200. Any break above targets $74500/$76200/$80000/$85500.
|
Momentum indicator (4-hour chart) |
Inference |
Value |
|
CCI(50) |
Neutral |
2.74 |
|
ADX |
Neutral |
|
It is good to buy on dips around $70000 with SL around $67000 for a TP of $80000.


