


 Aussie Ascent: AUDJPY Bulls Target 115.00 Following Broad-Based AUD Buying
  FxWirePro: USD/ZAR uptrend resumes rise toward key fibo
  FxWirePro: GBP/NZD topside capped, sellers still hold the advantage
  FxWirePro: USD/CNY recovers slightly from early decline but bears are not done yet
  Euro's Ascent: EURJPY Bulls Eye 186.00 as Yen Weakness Persists
  FxWirePro:EUR/USD slips as oil supply and conflict fears persist
  FxWirePro- Major European Indices
  FxWirePro:NZD/USD drifts lower, could be on verge of bigger drop
  FxWirePro -Major European Indices
  FxWirePro: GBP/USD drops towards 1.3350 level, heads deeper into bear territory
  FxWirePro: USD/ZAR rebounds strongly, upside pressure builds
  Pound Under Pressure: GBPJPY Pauses Five-Day Rally for Tactical Profit Booking
  FxWirePro: EUR/ NZD stays range-bound but maintains bearish bias
  AUDJPY Bullish Momentum Pauses: Profit Booking Offers Fresh Entry Window Near 112.50
  Sterling Surge: GBPJPY Eyes 214.00 as Yen Weakness Fuels Five-Day Rally
  FxWirePro: AUD/USD softens slightly, but remains bid overall


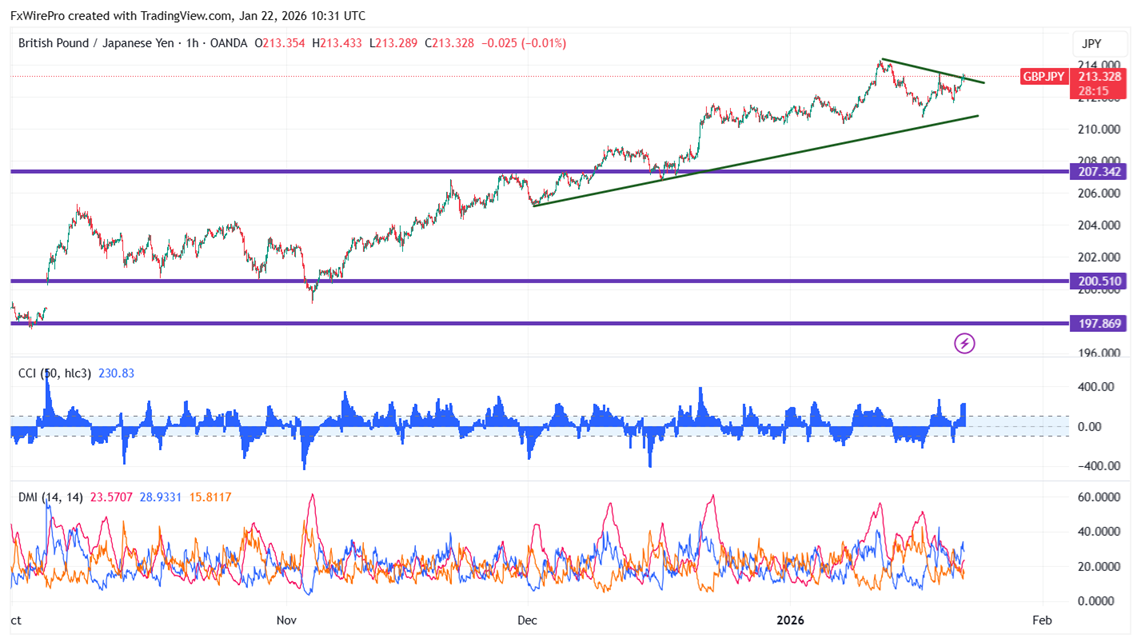
GBPJPY formed a double top around 213.50 and showed a minor sell-off. The intraday trend is bullish as long as support 211.50 holds. As of publishing, it is trading around 213.32; its intraday high is 213.43.
Oscillators and moving averages to forecast the trend of GBPJPY
CMP- 213.33
EMA ( 1-hour chart)
55-EMA- 212.55
200-EMA- 212.29
365-EMA- 211.85. The pair trades above the short (55- EMA) and long-term moving average (200 and 365 EMA).
Major Support- 212.75. Any breach below will drag the pair down to 212.35/211.85/211/210.70/210..
Major resistance - 213.50. Any break above 213.50 confirms minor bullishness; a jump to 214/214.29/215.18 is possible.
Indicator (1-hour chart)
CCI (50)- Bullish
Average directional movement Index- Bearish. All indicators confirm a bullish trend.
It is good to buy on dips around 212.80 with SL around 211.70 for a TP of 215.15.


