


 Gold Prices Fall Amid Rate Jitters; Copper Steady as China Stimulus Eyed
  Best Gold Stocks to Buy Now: AABB, GOLD, GDX
  FxWirePro: Daily Commodity Tracker - 21st March, 2022


After long 6 years of Bull run, S&P 500 is on its way to close the year in negative. S&P 500 is currently trading at 2045, down -1.3% for the year so far.
Since the financial crisis of 2008/09, S&P 500 has relied more on monetary stimulus and cheap funding for growth rather than rapid growth in US. FED's extraordinary monetary stimulus has also led to record pace of mergers and acquisitions, large dividend and stock buyback. However with FED now slowly winding up its stimulus (process already started with 25 basis points hike in December), economic growth now has to shoulder more to provide support to stocks.
In absence of growth and revenue, S&P 500 looks vulnerable. As inferred from the series in name, we are here to share charts and ideas that could be warning to investors.
And the idea here is,
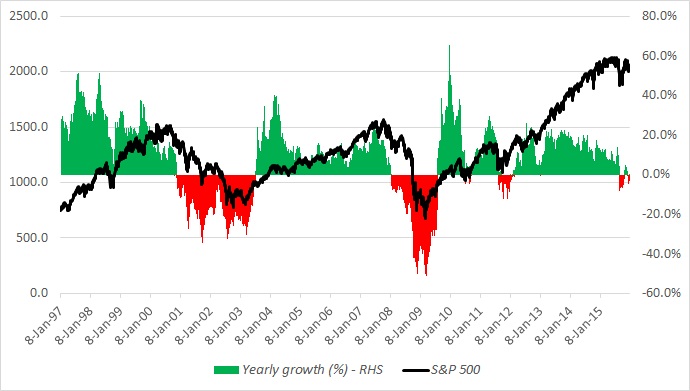
S&P 500 since 2013 has been diverging with its own pace, not in any abrupt fallout like that happened during 2011/12 debt ceiling drama and European crisis but a steady divergence. Pace of growth in S&P 500 (measured yearly) has been slipping steadily and this year its falling in negative to end the year.
Except for minor negative growth seen during this rise (2009-2015), historically fall in yearly growth has signaled stock market crash. The chart shows this has been the case for both in dot-com bubble burst and 2008 stock market crash.
While it sure is no guarantee that stocks are going to crash but heading into 2016, this diverges will keep flashing red light for us at FxWirePro.


