


 Vietnam’s population hit the 100 million milestone. Where’s it headed?
  Alcohol is one of the most dangerous drugs, yet its presence is ubiquitous in social settings and celebrations
  Trump has made more than $1 billion from crypto in a year. How?
  Smartphones are helping filmmakers tell the stories the movie industry overlooks
  Gold Surges Past $4150 on Dovish Fed Signals and Weak Jobs Data; Bullish Outlook Prevails
  USA at 250: the Black American struggle for life, liberty and the pursuit of happiness
  Citi Raises TSMC Price Target as AI Chip Demand Strengthens Growth Outlook
  Gold Pulls Back After Hitting $4,180 as Geopolitical Risk Sends Crude Higher
  Bernstein Names IAG, Ryanair as Top European Airline Stocks Ahead of Earnings
  Goldman Sachs Raises USD/JPY Forecast, Sees Yen Weakness Persist Through 2027


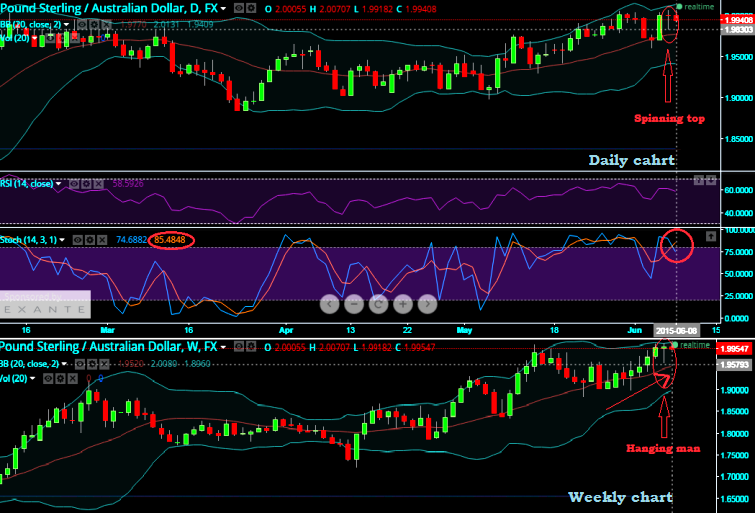
Remember always, technicals can never be studied & interpreted in an isolation; so many confirmations from multiple angles are spotted out here on this pair.
A spinning top is formed at 2.0003 levels on upward rallies on daily chart. It signifies that the bulls are losing conviction in the currency upswings and that a reversal may be in the cards.
In addition to that the %D line crossover above 80 levels strongly signifies overbought scene on slow stochastic curve (%D line at 86.2737 & %K line at 77.1239).
Hanging man occurred on uptrend rallies on weekly chart which is another indication for bearish momentum.
RSI (14) showing downward convergence with price line at 59.0576 levels. Contemplating all these technical indications we would foresee the pair is to test the targets of 1.9832 levels with strict stop loss around 2.004 levels.
Currency Option Strategy: Write ITM calls
Short Deep In-The-Money calls (strike at around 1.9559) without having any spot positions.
The major objective of this strategy is to collect the premiums when the call options drop in value or expire worthless as the underlying currency price declines.
Profit is limited to the extent of premium collected from short side.

- News

- Economy

- Central Banks
- Investing
- Research
- Roundups
- Digital Currency
- Insights
- Technical Analysis
- Technology
- Business
- Law
- Health
- Nature
- Fintech
- Science
- Topic
- Opinions
- ©Econometrics LLC . All Rights Reserved.
Spinning top threatens GBP/AUD bulls, Write ITM calls
Monday, June 8, 2015 11:25 AM UTC
Editor's Picks


- Market Data
Most Popular


