


 FxWirePro: GBP/AUD takes back some lost ground
  FxWirePro: USD/JPY steadies around 158.75, bias bullish
  FxWirePro: USD/CAD extends decline on broad dollar weakness
  FxWirePro- Major Pair levels and bias summary
  Ethereum’s Healthy Correction: Bulls Eye Strategic Re-Entry at 2,150 USD Following Profit-Booking Pullback
  FxWirePro- Major Pair levels and bias summary
  FxWirePro: USD/ZAR slips sharply lower as US-Iran ceasefire lifts risk appetite
  FxWirePro: AUD/USD edged lower as early optimism over U.S.–Iran peace talks fade
  FxWirePro: EUR/AUD claws back some losses but rcovery likely muted
  FxWirePro- Major Crypto levels and bias summary
  FxWirePro- Woodies Pivot(Major)
  Kiwi Ascendant: NZDJPY Bulls Eye Multi-Year Peaks Amid Triple-Day Rally
  Aussie Consolidates After Peak: AUDJPY Bulls Eye a Strategic Entry for the 115.00 Target
  FxWirePro: GBP/USD climbs to 4 -week high as ceasefire deal gives bulls traction
  FxWirePro:NZD/USD continues to recovers , upside pressure builds
  FxWirePro: GBP/USD bulls remain cautiously optimistic


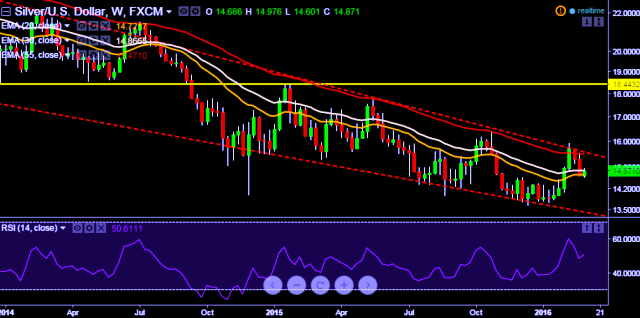
- Pair is currently trading at $14.86 levels.
- It made intraday high at $14.97 and low at $14.80 levels.
- Weekly chart suggests the bearish trend till the time pair holds key resistance at $15.70/$15.92 levels.
- A daily close above key resistance will turn the trend bullish and drag the pair towards multiyear high.
- Alternatively, current reversal from $15.92 will drag the pair back below $14.00 marks.
- Initial support levels are seen at $14.65, $14.41 and $14.03 levels.
- On the top side key resistance levels are seen at $14.97, $15.20 and $15.70 thereafter.
We prefer to take short position in XAG/USD around $14.90, stop loss $15.70 and target $13.60 levels.


