


 Today’s space race could turn fatal if we don’t agree on new rules
  China’s AI Manufacturing Boom Masks Weak Consumer Economy, Citi Says
  J.P. Morgan Sees Potential Vestas Guidance Upgrade Amid Strong Wind Energy Demand
  How AI prompting turned writerly description into an everyday skill
  Goldman Sachs: US Dollar Likely to Stay Strong Despite Oil Price Retreat
  World Cup technology: from ref cams to AI analysts, cutting-edge research is changing the game
  Sell the Bounce": Gold Rally Stalls Near $4165 as Fed Hawks Slam the Door on Rate Cuts — Targets $4000/$3600


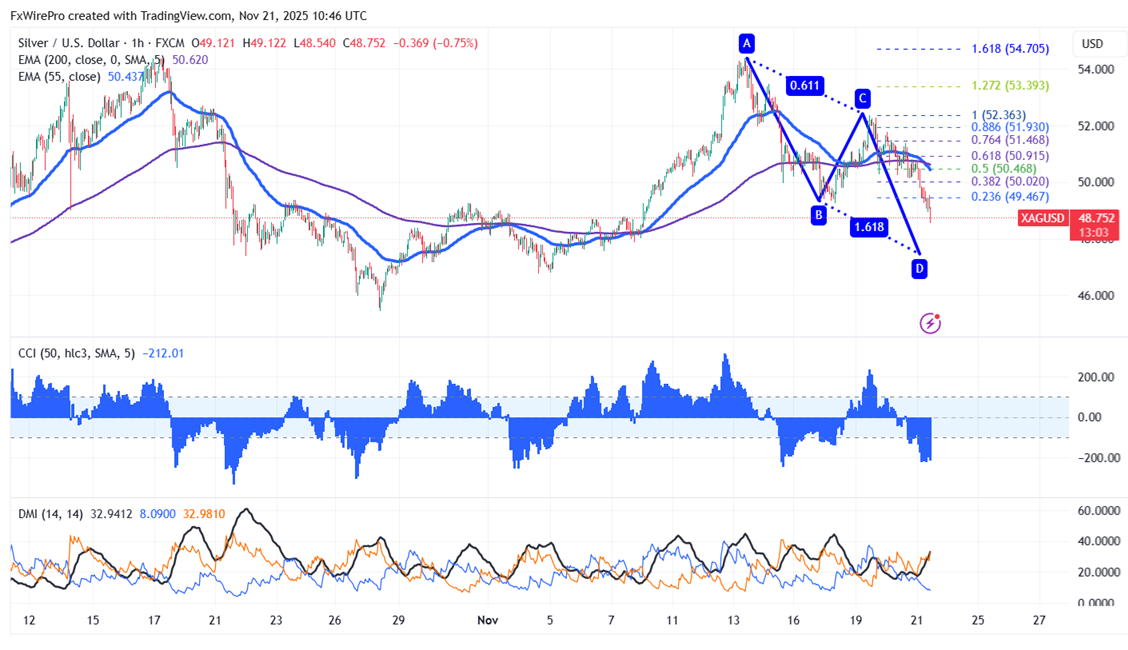
Silver Bulls Load Up: Bullish AB=CD Pattern Signals Sharp Rebound from $47.50 as Mixed US Jobs Data Slashes Fed Cut Bets
Chart pattern- Bullish AB=CD pattern
Potential Reversal Zone (PRZ)- $47.46
Silver declined sharply after hitting a multi-year high at $54.27. It hit an intraday low of $48.80 and is currently trading around $48.84.
September's long-overdue US jobs report offered a traditional mixed bag: nonfarm payrolls increased 119,000—more than double the anticipated 51,000—driven by strong hiring in healthcare and restaurants; however, the unemployment rate rose to 4.4%, its highest since October 2021, confirming a softening labor market. With October data still missing owing the government closure, the conflicting signals—strong job creation combined with increasing unemployment—have confused the December outlook of the Fed and lowered rate-cut probabilities to just 35–40%. Many experts have penciled in the next easing move for early 2026.
Trading Strategy and Key Levels for Silver
The commodity is trading below the short-term (34 and 55 EMA) and long-term moving average (200 EMA) in the 1-hour chart. The near-term support is around $48, and any violation below will drag the commodity to $47.45/$46.70/$45. The immediate resistance is at $49; any breach above targets $49.45/$50/$50.80/$51.26/$52.40.
It is good to buy on dips around $47.50-55 with a stop-loss at $46 for a TP of $52.


