


 FxWirePro- Major Pair levels and bias summary
  FxWirePro- Woodies Pivot(Major)
  Energy Surge Ignites US Inflation: USDCHF Eyes Support Amid Dollar Sell-Off
  FxWirePro:NZD/USD uptrend loses momentum but bullish setup remains
  FxWirePro: AUD/USD retreats slightly but trend is still bullish
  FxWirePro: USD/ZAR recovers slightly but trend is still bearish
  FxWirePro: EUR/AUD downtrend loses steam but outlook still bearish
  FxWirePro: GBP/USD biased higher but rally currently stretched
  FxWirePro- Woodies Pivot(Major)
  FxWirePro: USD/CAD recovers slightly but bearish outlook persists
  NZDJPY Bulls Charge Toward 95.00: Safe-Haven Exodus Drives Kiwi Rally
  FxWirePro: USD/ZAR edges lower ,investors remain on edge
  FxWirePro- Major Pair levels and bias summary
  FxWirePro: EUR/AUD under pressure as key support gives way
  Bitcoin’s Volatile Reset: ETFs Rebound as Bulls Eye USD 80,000 Milestone
  FxWirePro: GBP/NZD down trend loses steam, remains on bearish path
  FxWirePro: GBP/USD bulls remain cautiously optimistic


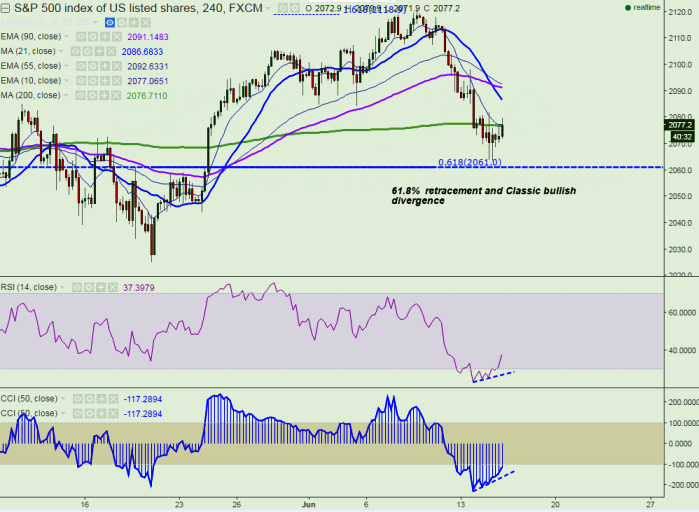
- Pattern formed – classic bullish divergence
- Potential Reversal Zone- 2060
- S&P500 has recovered after making a low of 2063.70.it is currently trading around 2078. Short term trend is lightly bullish as long as support 2060 holds.
- Any indicative break below 2060 will drag the index down till 2052 (90 day EMA)/2044.
- S&P500 index resistance is around 2077 (200 4H MA) and any break above targets 2088/2093/2108.50.
It is good to buy at dips around 2072-75 with SL around 2060 for the TP of 2098/2108


