


 FxWirePro: USD/CNY neutral in the near-term, scope for downward resumption
  FxWirePro- Major Pair levels and bias summary
  FxWirePro- Major Crypto levels and bias summary
  FxWirePro: USD/JPY holding bid into weekend
  FxWirePro: USD/CAD recovers slightly but bearish outlook persists
  Euro Holds the Line: EURUSD Finds Support at the 365-EMA as Peace Talks Loom
  Ethereum Consolidates: Bullish Technicals Point to a Potential $3,000 Breakout
  FxWirePro: GBP/USD biased higher but rally currently stretched
  FxWirePro: USD/ZAR edges lower ,investors remain on edge
  FxWirePro- Major European Indices
  FxWirePro: GBP/NZD down trend loses steam, remains on bearish path
  FxWirePro:NZD/USD uptrend loses momentum but bullish setup remains
  NZDJPY Bulls Charge Toward 95.00: Safe-Haven Exodus Drives Kiwi Rally
  Bitcoin’s Volatile Reset: ETFs Rebound as Bulls Eye USD 80,000 Milestone
  FxWirePro- Major Pair levels and bias summary
  FxWirePro- Woodies Pivot(Major)
  FxWirePro: AUD/USD retreats slightly but trend is still bullish


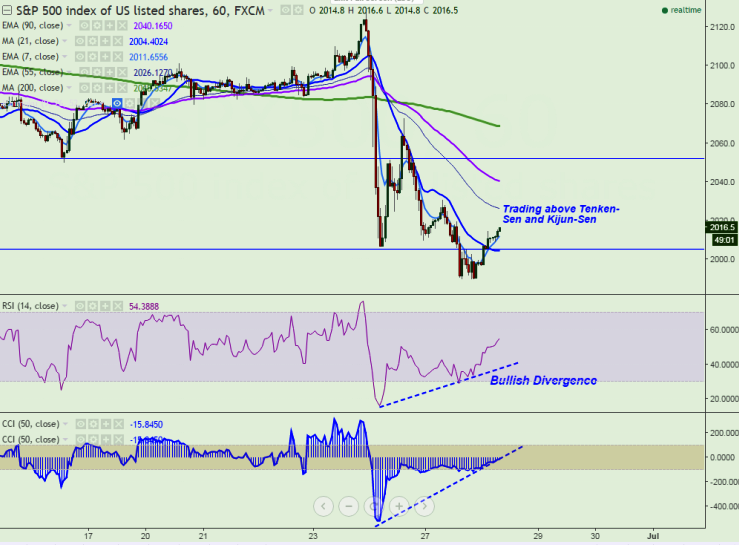
- Major intraday resistance -2010 (Hourly Kijun-Sen)
- Major intraday support- 2000
- Pattern Formed (Hourly chart)- Bullish divergence (CCI (50) and RSI (14).
- The index has recovered after making a low of 1989. It is currently trading around 2012.80.
- The S&P500 is trading slightly well above 2010 (hourly Kijun-Sen) and a jump till 2026 (55 H EMA)/2040 (61.8% retracement of 2072 and 1989).
- The index should break above 2072 for the bearish trend from 2127 till 1989 to complete. Any break above 2072 targets 2100/2120/2127.
- On the lower side , major support is around 2000 and break below will drag the index down till 1989/1972/1960.
It is good to buy at dips around 2010 with SL around 2000 for the TP of 2026/2040


