


 Mexico's Undervalued Equity Market Offers Long-Term Investment Potential
  US Gas Market Poised for Supercycle: Bernstein Analysts
  Moldova Criticizes Russia Amid Transdniestria Energy Crisis
  ETH Bounces as Shorts Cover, Yet ETF Bleed Warns $1,850 Resistance Won’t Break
  Lithium Market Poised for Recovery Amid Supply Cuts and Rising Demand
  Today’s space race could turn fatal if we don’t agree on new rules
  FxWirePro: USD/CNY hits one –month high, scope for further upside
  FxWirePro: USD/ZAR slips as dollar weakens after PCE inflation data
  Gold Prices Fall Amid Rate Jitters; Copper Steady as China Stimulus Eyed
  2025 Market Outlook: Key January Events to Watch


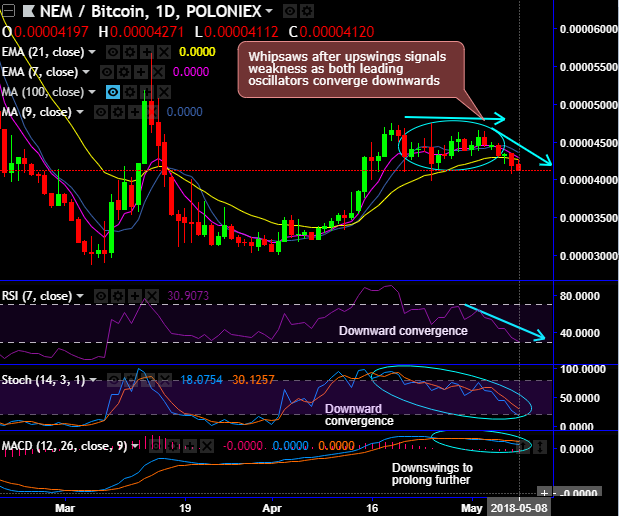
NEM (XEMBTC) attempt to bounce back but restrained below 21DMAs, as a result, the pair forms shooting star pattern which is bearish in nature.
If you observe the daily plotting, the price behavior of this pair has gone in whipsaws pattern on 7DMAs, this pattern preceding an uptrend would be the bearish signal (refer daily chart).
Both leading oscillators (RSI & stochastic curves) on this timeframe has shown constant downward convergence that indicates the strength and the bearish momentum.
Consequently, the current price has slid below DMAs to trade at 0.00004119 levels with bearish MACD crossover. For now, more price slumps are expected upto 0.00004070 levels on most likely bearish EMA crossover.
However, on the contrary, as investors get more exposure to crypto trading and learn decisively, price volatility and market turbulence are quite mutual events. Hence, there’s no cause of concern when a crypto dips. Nevertheless, when the slump confines only to selective crypto-asset classes, then apprehension sets in. That was the case with NEM (XEM) investors.
The driving factors of why investing in XEM is shown below:
NEM has partnered with several lucrative sets of enterprises such as Paytomat, Kchain, Dargonfly fintech, and ProximaX etc,
On the flips side, an increased penetration as XEM is added to ABRA wallet, by counting on XEM, the wallet’s developers unbolted it for accessing trading on a wider community of users.
While publicizing the cutting-edge add-ons, the CEO, and founder of Abra Bill Barhydt mentioned that:
“By adding the five new cryptocurrencies to the already robust list of coins Abra supports, we are continuing to offer exposure to assets that have traditionally been difficult to access in a simple and secure way”.
Well, we wish to conclude by reminding investment refers to a long-term phenomenon or any mechanism deployed to generate future cash inflows. Thus, even though you see abrupt price dips that would now be deemed as panicky shorts which are momentary.
Currency Strength Index: FxWirePro's hourly BTC spot index has shown -153 (which is bearish), while hourly USD spot index was at 75 (bullish) while articulating at 10:07 GMT. For more details on the index, please refer below weblink:
http://www.fxwirepro.com/currencyindex.
FxWirePro launches Absolute Return Managed Program. For more details, visit:


