


 We combed through old botanical surveys to track how plants on Australia’s islands are changing
  Extreme heat, flooding, wildfires – Colorado’s formerly incarcerated people on the hazards they faced behind bars
  Burkina Faso and Mali’s fabulous flora: new plant life record released
  Lake beds are rich environmental records — studying them reveals much about a place’s history
  Wildfires ignite infection risks, by weakening the body’s immune defences and spreading bugs in smoke
  The UK is surprisingly short of water – but more reservoirs aren’t the answer
  Drug pollution in water is making salmon take more risks – new research
  How to create a thriving forest, not box-checking ‘tree cover’
  An unexpected anomaly was found in the Pacific Ocean – and it could be a global time marker
  How is Antarctica melting, exactly? Crucial details are beginning to come into focus
  Thousands of satellites are due to burn up in the atmosphere every year – damaging the ozone layer and changing the climate


Greenhouse gas emissions are at an all-time high, with yearly emissions equivalent to 54 billion tonnes of carbon dioxide. Humanity has caused surface temperatures to warm by 1.14°C since the late 1800s – and this warming is increasing at an unprecedented rate of over 0.2°C per decade. The highest temperatures recorded over land (what climate scientists refer to as maximum land surface temperatures) are increasing twice as fast. And it’s these temperatures that are most relevant to the record heat people feel or whether wildfires spawn.
These changes mean that the remaining carbon budget for 1.5°C - the amount of carbon dioxide global society can still emit and keep a 50% chance of holding temperature rise to 1.5°C – is now only around 250 billion tonnes. At current emission levels, this will run out in less than six years.
These are the findings of a new report that I have published with 49 other scientists from around the world. It tracks the most recent changes in emissions, temperatures and energy flows in the Earth system. Data that can inform climate action. For example, by informing how fast emissions need to fall to meet international temperature goals. The first report, in what is to become a series of annual reports, has captured the pace at which Earth is heating up.
We are launching an initiative called Indicators of Global Climate Change which brings all the necessary ingredients together to track human-induced warming year by year for the first time. We track emissions of both greenhouse gases and particulate pollution and their warming or cooling influences to determine their role in causing surface temperature change.
We use rigorous methods based on those established in the comprehensive United Nations Intergovernmental Panel on Climate Change (IPCC) assessments. IPCC assessments are trusted as a reliable source of information by governments and their climate policy negotiators. Yet, they are published around eight years apart.
In a rapidly changing world where policies can shift quickly, this leaves an information gap: trusted indicators on the state of the climate have been missing from annual UN climate negotiations.
Climate data for all to use
In this first report, we collected evidence on all greenhouse gas emissions and their changes during the pandemic. From this, we built the evidence to quantify the temperature change caused by human activity. This tells us how close the world is to breaching the long-term goal of holding temperatures to within 1.5°C set by the Paris agreement, and how quickly we are approaching it.
In this first report, we explained how much things have changed since the last comprehensive assessment by the IPCC (the sixth assessment report, or AR6) which evaluated data up to 2019.
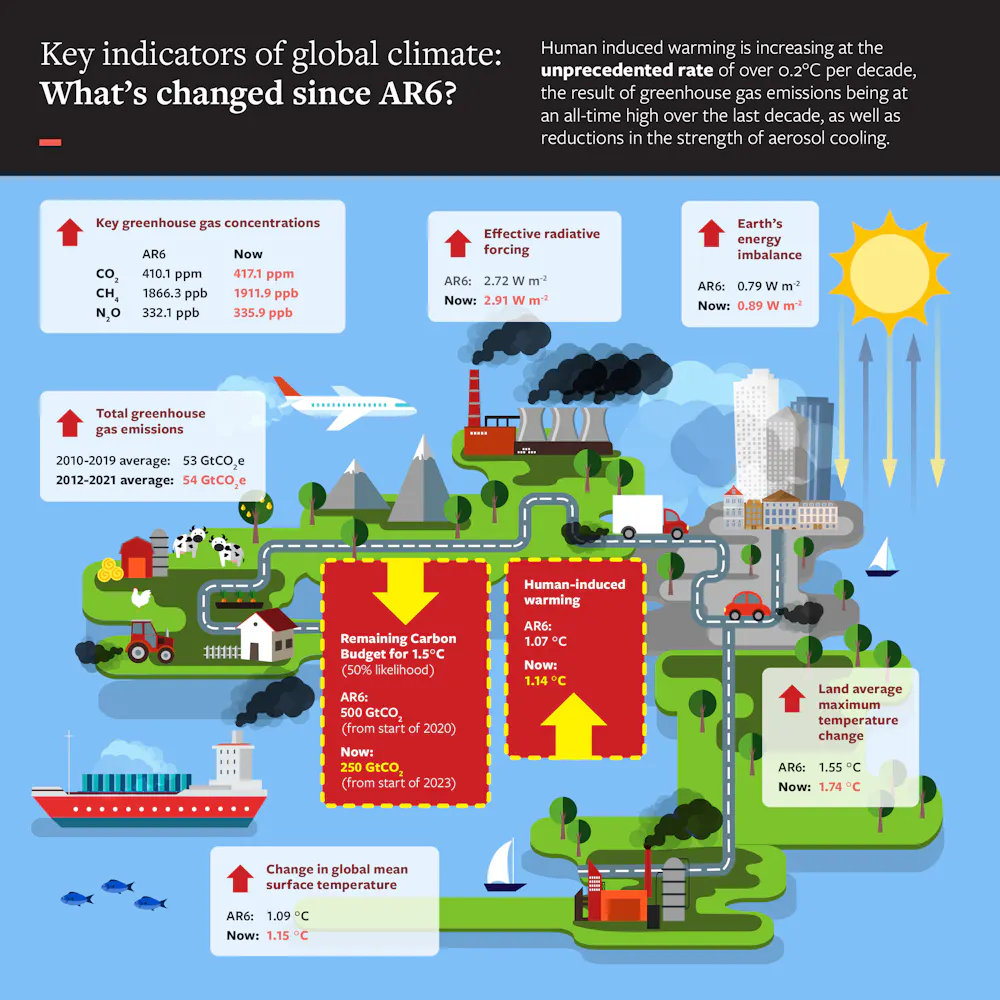
Greenhouse gas emissions are up and so are temperatures. Indicators of Global Climate Change, Author provided
To evaluate how much of the observed temperature changes are caused by human activity, we needed to track how these activities alter energy flows within the Earth system. Emissions of greenhouse gas accumulate in the atmosphere, trapping heat, while polluting particles, such as sulphate aerosols produced from burning coal, tend to cool the Earth by reflecting more sunlight. In recent years, greenhouse gases have risen strongly but pollution has fallen around the world. Both these trends compound to warm the climate. We assessed that this is causing the highest-ever rate of global warming – over 0.2°C per decade.
In future years, we would like to involve a wider scientific community and especially make it possible to track climate extremes, such as heatwaves, floods and wildfires, like those currently sweeping through Canada. We mark our intention for doing this in this first year by tracking how daily maximum temperatures have increased over land. These are rising twice as fast as the average temperature – and are already 1.74°C above where they were in the 1800s.
We are hoping this data is used by the main users of IPCC information – namely, government climate negotiators – so they understand the scale of action needed. We also want a much wider audience to have access to timely and trustworthy climate data in a fully transparent way, where the scientific methods are documented for the public record, so we are building an open data dashboard that anyone can access to see the data.
We want to build trust in our exercise and so we present this data without advocating for particular policies. We adopt the IPCC mantra of being “policy relevant” but not “policy prescriptive”. We want to let the data speak for itself, giving policymakers the agency to understand the pace of climate change and necessary actions.
As we produce a series of these reports over the coming years, depending on the choices made throughout society, we may track continued high rates of emissions or warming, or a rapid emission decline, with warming levels beginning to stabilise. Whatever happens, the global climate science community will be watching and reporting.


