


 Physicists zoom into the birth of cosmic rainstorms with new CERN study
  fnny Beta Launches With a Simple Idea: Find an Event, Show Up, Get Rewarded
  Europe can’t achieve space sovereignty alone. Here’s why
  Hawkish Fed Fuels Gold Sell-off: Gold Dives Below $4300 Amidst Rate Hike Fears
  Who should own the knowledge that underpins AI technology?
  FxWirePro- Crypto Weekly Alpha: ETF Rebounds, L2 Rallies & Key Resistance Levels


 Add as a preferred source on Google
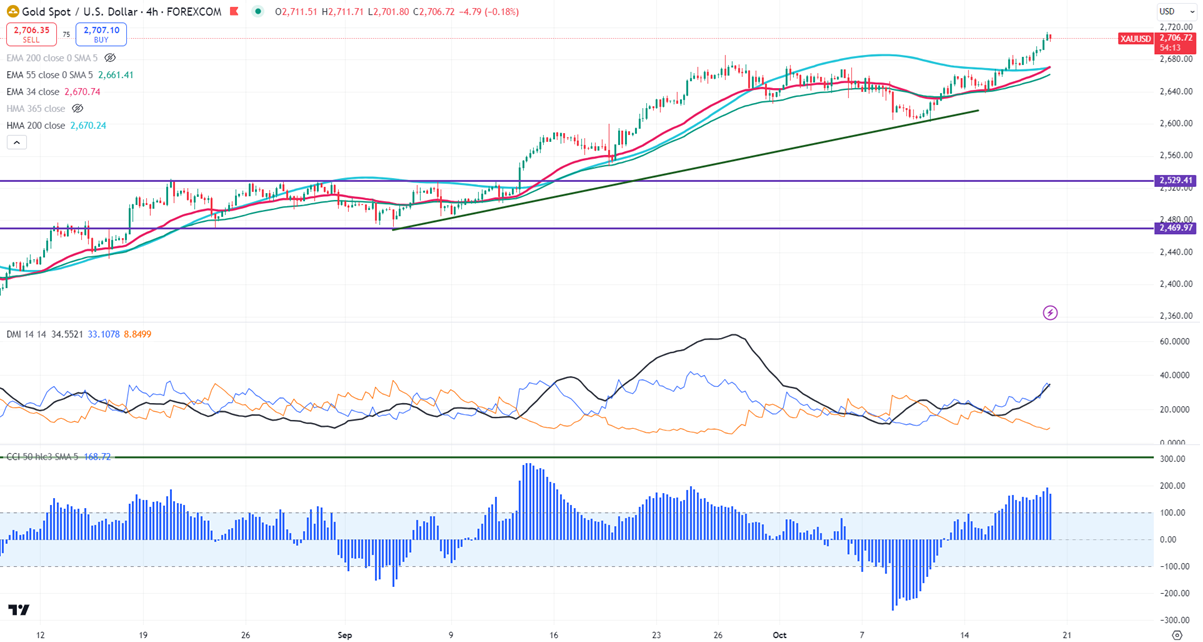
Gold hits fresh all-time on increase in demand for safe-haven assets. It hit a high of $2714 yesterday and is currently trading around $2705.
US economic data
Positive news came from the jobless claims, which dropped to 241,000, much lower than expected and down from the revised 260,000 from the previous week. US retail sales also did better than predicted, rising by 0.4% from the month before, compared to an expected 0.3% increase. Nonetheless, positive retail sales and strong jobless claims are unlikely to alter the course of the Fed's monetary policy.
ECB rate cut
ECB cuts rates as expected and upcoming months will be crucial as the ECB evaluates economic conditions and decides on its future monetary policy approach.
US dollar index-
The US dollar index showed a minor decline due to profit booking. A break above 104 would confirm a continuation of the bullish trend.
Based on the CME FedWatch Tool, the likelihood of a 25 basis point rate cut in November has risen to 92.2%, up from 89.50% just a week ago.
Technical (4 hour chart)-
The yellow metal trades above short-term (34 and 55 EMA ) and long-term (200- and 365 Hull MA) in the 4-hour chart.
The near–term support is around $2685, a break below targets $2670/$2660/$2638. Major bearish continuation only below $2470.The yellow metal faces minor resistance around $2715 and a breach above will take it to the next level of $2739/$2750.
Indicator (4- hour chart)
CCI (50)- Bullish
Average directional movement Index - Bullish
It is good to buy on dips around $2660 with SL around $2638 for TP of $2710.







