


 JPY Action Bias: Extremely Bullish Surge Ignites Across NZD, GBP & AUD
  FxWirePro: EUR/AUD bears maintain upper hand
  FxWirePro: AUD/USD edges lower, but bullish outlook persists
  FxWirePro: NZD/USD trades in narrow range ,outlook bullish
  FxWirePro: GBP/USD hits one-month high, scope for further upside
  FxWirePro: GBP/NZD downtrend slows, but bearish sentiment remains
  FxWirePro: GBP/NZD gains some upside momentum but still bearish
  FxWirePro: GBP/AUD loses momentum but outlook is bullish
  FxWirePro: GBP/USD advance after softer US inflation dims Fed rate hike bets
  AUDJPY Extremely Bullish Above 113: Strong AUD Fuels Fresh Rally – Buy Dips at 113 Targeting 115
  FxWirePro- Woodies pivot (Major)
  GBPUSD, AUDUSD & NZDUSD Turn Extremely Bullish: Strong Positive Momentum Drives Major Pair Action Bias
  Crypto Major Pair Action Bias: ETHUSD Bullish as BTCUSD, SOLUSD & XRPUSD Stay Neutral
  FxWirePro: NZD/USD steadies around 0.5830,retains bid tone
  NZDJPY Extremely Bullish Above 94: Broad NZD Buying Fuels Fresh Upside – Buy Dips at 93.70 Targeting 95
  FxWirePro: USD/CAD falls after BoC rate hold and weak U.S. producer inflation
  EUR/USD Holds Bullish Tone Despite Pullback from Yesterday’s High


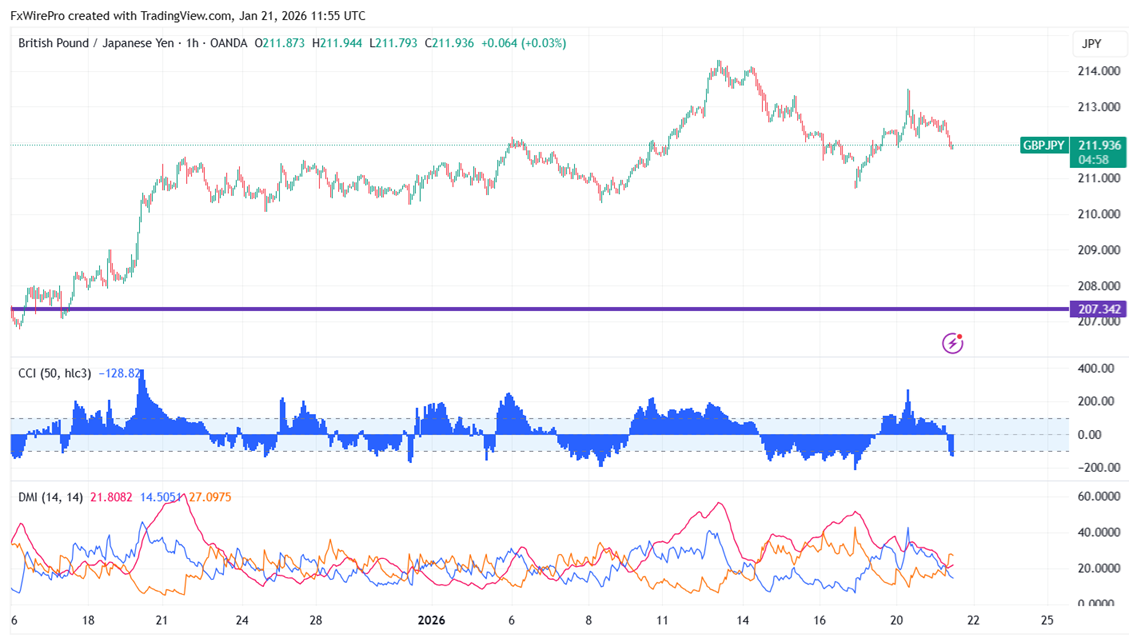
GBPJPY pared some of its gain after mixed UK CPI data. The intraday trend is bullish as long as support 210 holds. As of publishing, it is trading around 211.93; its intraday low is 211.79.
Oscillators and moving averages to forecast the trend of GBPJPY
CMP- 211.89
EMA ( 1-hour chart)
55-EMA- 212.30
200-EMA- 212.19
365-EMA- 211.74. The pair trades below the short (55- EMA) and long-term moving average, 200 EMA, and above 365 EMA.
Major Support- 211.70. Any breach below will drag the pair down to 211/210.70/210..
Major resistance - 212.50. Any break above 212.50 confirms minor bullishness; a jump to 213/213.50/214/214.29/215.18 is possible.
Indicator (1-hour chart)
CCI (50)- bearish
Average directional movement Index- Bearish. All indicators confirm a bearish trend.
It is good to buy on dips around 211.70 with SL around 210.70 for a TP of 214.


